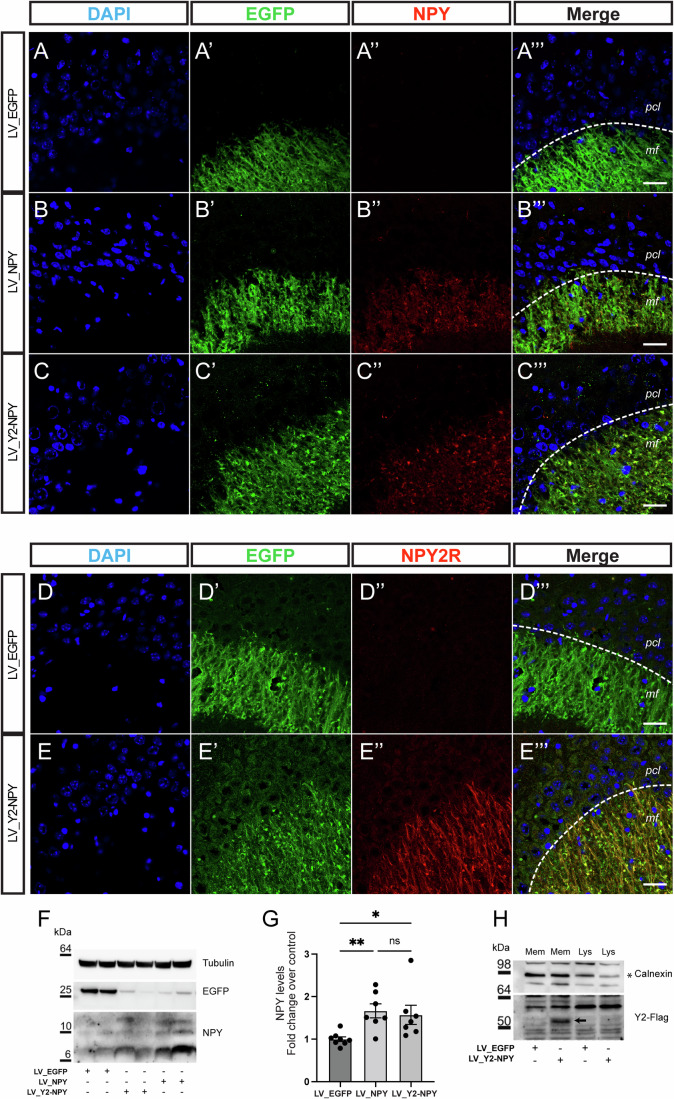
Figure 5. Characterization of LV transgene expression in the WT mouse.
(A–E) Representative confocal images of immunofluorescence performed on the WT mouse brain injected with either LV_EGFP (A-A”’ and D-D”’), LV_NPY (B-B”’), or LV_Y2-NPY (C-C”’ and E-E”’). The green signal highlights the mossy fiber pathway of transduced dentate granule cells projecting their axons onto CA3 pyramidal neurons. (A–C) Staining for DAPI (blue), EGFP (green), and NPY (red) are shown. (D, E) Staining for DAPI (blue), EGFP (green), Y2R (red), are shown. Scale bar = 20 µm. (F, G) Representative western blot (F) and quantification (G) of the indicated proteins in extracts from hippocampi of WT mice injected with the indicated vectors. Protein levels are normalized for loading (Tubulin) and are shown as fold change over control (LV_ EGFP = 1 ± 0.05, n = 8 mice; LV_NPY = 1.66 ± 0.16, n = 7 mice; LV_Y2-NPY = 1.57 ± 0.22, n = 7 mice p = 0.0007). Values are presented as means ± SEM. Statistical significance was calculated using the Kruskal–Wallis one-way analysis of variance followed by Dunn’s post hoc test. *p < 0.05; **p < 0.01. (H) Representative western blot of the indicated proteins in the membrane fraction (Mem) or total extract (Lys) of hippocampi from WT mice injected with the indicated vectors. The arrow indicates the Y2-flag band in the western blot image. pcl pyramidal cell layer, mf mossy fiber. Source data are available online for this figure.

