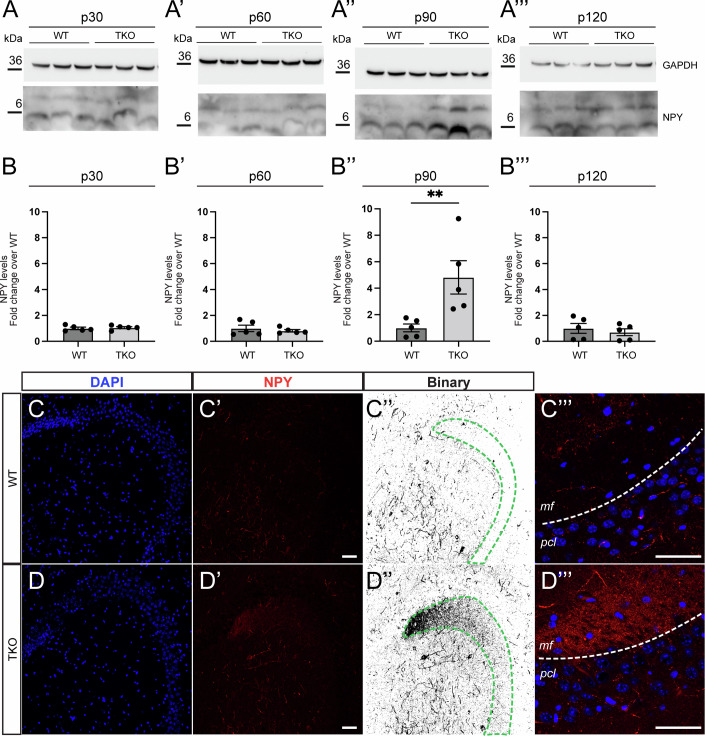
Figure 6. Upregulation of NPY in the hippocampus of the adult TKO mouse.
(A, B) Representative western blot (A-A”’) and quantification (B-B”’) of NPY in extracts from hippocampi of TKO mice at the indicated timepoints: 30 postnatal days (p30) for A and B; 60 postnatal days (p60) for A’ and B’; 90 postnatal days (p90) for A” and B” and 120 postnatal days (p120) for A”’ and B”’. Protein levels were normalized for loading (GAPDH) and are shown as fold change over control (WT). Data were the mean ± SEM of five mice for each genotype for each timepoint. (B) WT = 1 ± 0.09; TKO = 1.05 ± 0.07; p = 0.8413 (B’) WT = 1 ± 0.24; TKO = 0.08 ± 0.09; p > 0.9999 (B”) WT = 1 ± 0.29; TKO = 4.82 ± 1.26; p = 0.0079 (B”’) WT = 1 ± 0.37; TKO = 0.7 ± 0.26. p = 0.4206; Statistical significance was calculated using the Mann–Whitney U-test. **p < 0.01. (C, D) Representative confocal images of WT (C-C”’) and TKO (D-D”’) mice at 100 days of age. Immunofluorescence staining for DAPI (blue) and NPY (red and binary) is shown. Note the mossy fiber pathway, containing dentate granules projecting axons onto CA3 pyramidal neurons, which is ectopically expressing NPY only in the TKO mice. Scale bar = 50 µm. C”’ and D”’ show a higher magnification of the mossy fiber at the CA3 level of WT (C) and TKO (D) mice. Immunofluorescence staining for DAPI (blue) and NPY (red). Scale bar = 50 µm. pcl pyramidal cell layer, mf mossy fiber. Source data are available online for this figure.

