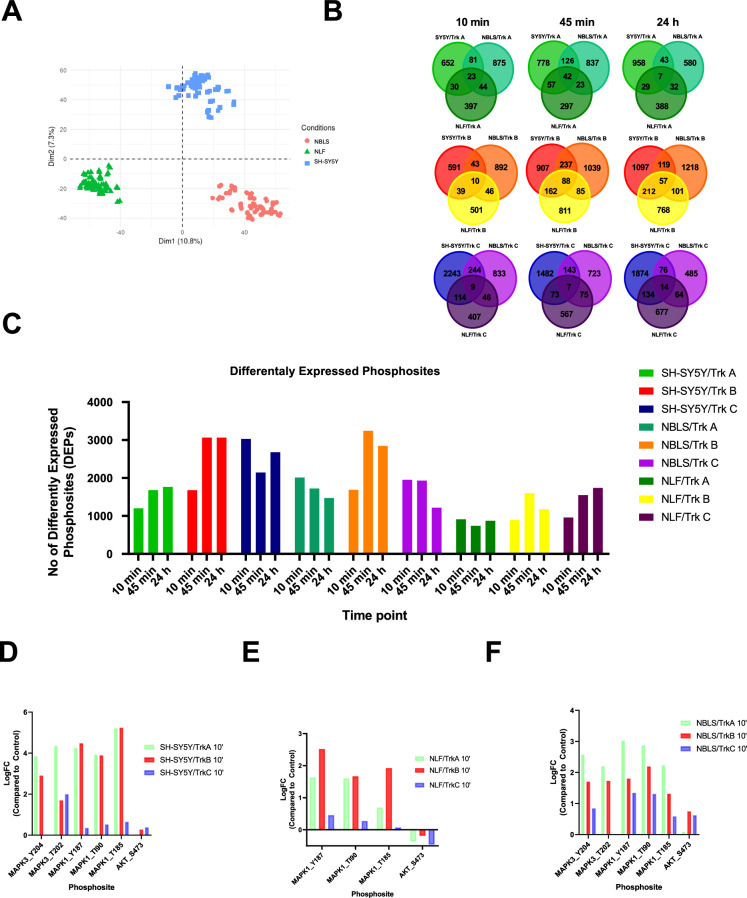
Fig. 4.
Overview of the phosphoproteomics data. (A) Principal component analysis of all samples (n = 216). (B) Overlapping upregulated differently expressed phosphosites (DEPs) (adjusted p-value < 0.05; absolute fold change > 1.5 from unstimulated cells) across cell lines at each time point of ligand stimulation. (C) Number of differently expressed phosphosites in each cell line at each time point of ligand stimulation. (D–F) Confirmation of LogFC of Akt and ERK1/2 phosphosites in each cell line compared to unstimulated control cells.

