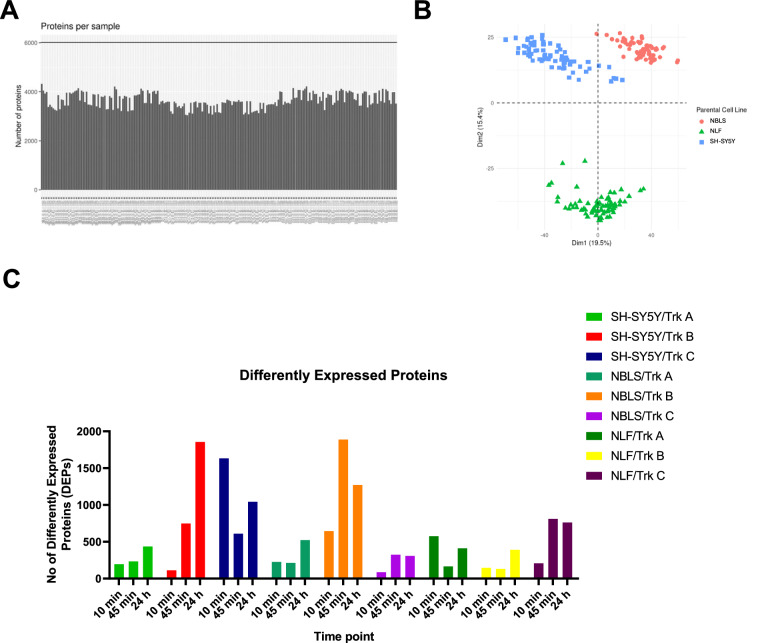
Fig. 5.
Overview of the total proteomics data. (A) Number of proteins identified in each sample (n = 215). To note, one of the technical replicates for the untreated NLF/NTRK1 total proteomics sample was removed after preprocessing and normalisation due to low number of proteins identified by MS. (B) Principal component analysis (PCA) of the samples (C) Number of differently expressed proteins in each sample at each time point (adjusted p-value < 0.05, absolute fold change > 1 from unstimulated cells).

