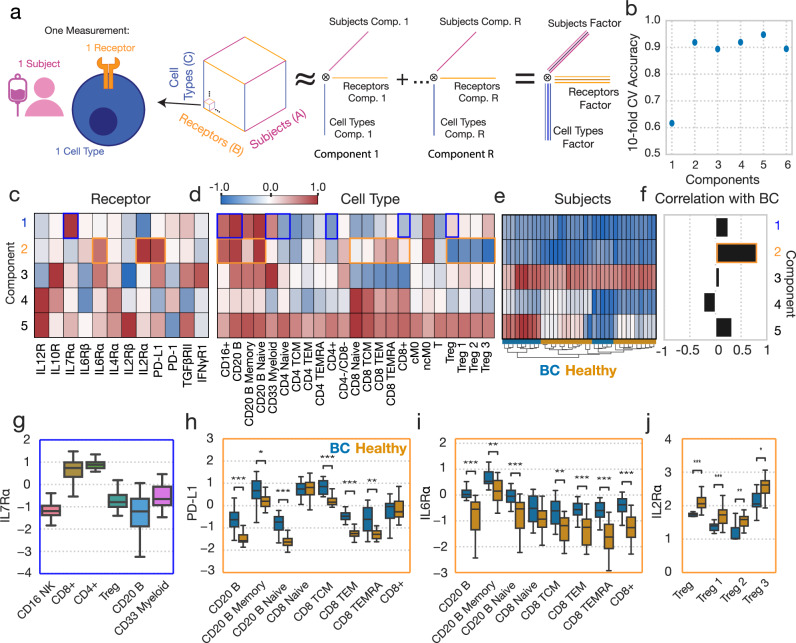
Fig. 4. CPD reveals patterns of receptor abundance variation.
a Schematic of CPD. Receptor data is organized into a three-dimensional tensor with axes of subject, cell type, and receptor. This tensor is reduced into sum of the outer products of rank 1 tensors (components), allowing for easy visualization. b The accuracy of a logistic regression classifier upon tenfold cross-validation, using the CPD subject factors with varying numbers of components. (c, d) Component values for each receptor (c) and cell type (d). e A heatmap of the subject factor matrix, with the subjects hierarchically clustered. Subject status is indicated by the coloring along the bottom. f The univariate correlations of each component with subject disease status (healthy = 0, BC = 1). g IL7Rα response across cell types (n = 36). h PD-L1 abundance across cell types, separated by subject disease status (healthy n = 22, BC n = 14). i IL6Rα abundance across cell types, separated by subject disease status. j IL2Rα abundance across cell types, separated by subject disease status. For all box plots, the center line denotes the median, the box limits denote the upper and lower quartiles, and the whiskers denote the 1.5x interquartile range. Significance was derived using the Mann–Whitney U test comparing those measurements from healthy donors to those of BC patients. Components and their associated plots are denoted by their color. *, **, and *** represent p values less than 0.05, 0.005, and 0.0005, respectively.

