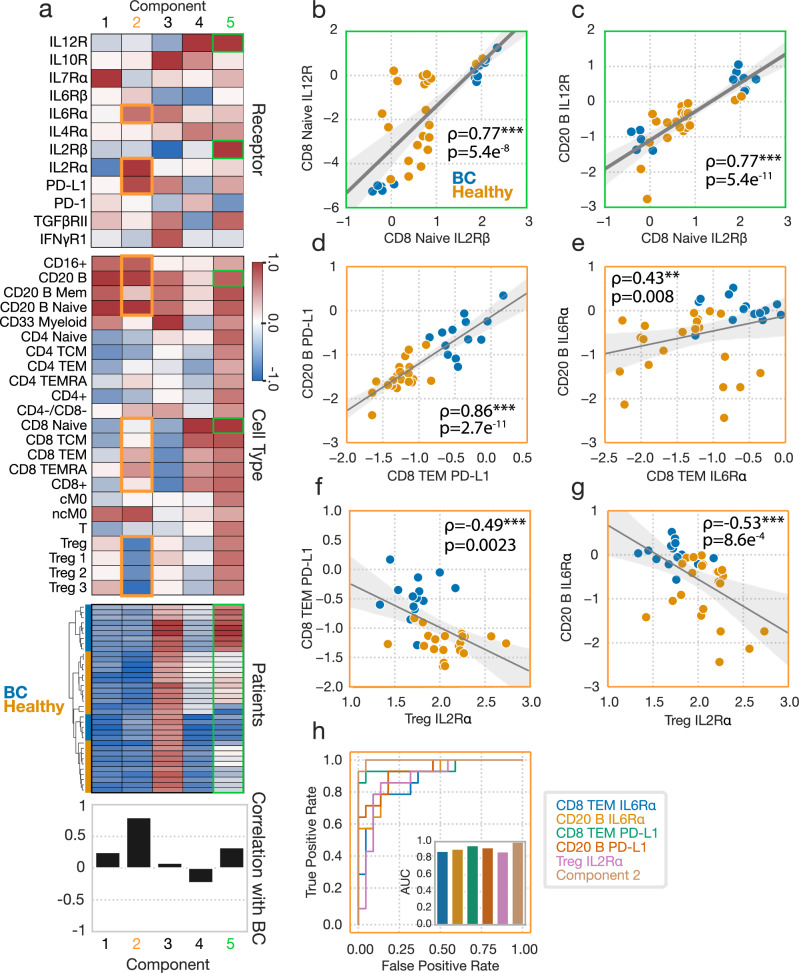
Fig. 5. Dissecting the patterns of receptor variation define concerted molecular programs.
a Receptor abundance data factorization from Fig. 4. b IL2Rβ versus IL12R abundances in CD8 naïve cells across subjects (n = 36). All reported correlations are Pearson correlations. c IL2Rβ abundances in CD8 naïve cells versus IL12R abundance in B cells for each subject. (b-e) Correlation across subjects between CD8 naïve IL2Rβ and IL12R (b), CD8 naïve IL6Rα and B cell IL6Ra (c), CD8 TEM PD-L1 and B cell PD-L1 (d), CD8 IL6Rα and CD20 B IL6Rα (e), Treg IL2Rɑ and CD8 TEM PD-L1 (f), and Treg IL2Rɑ and CD20 B IL6Rα (g). h ROC curve for the separation provided by several of the receptor amounts measurements, alongside component 2. AUC plots for each feature are also shown. Components and their associated plots are denoted by their color. *, **, and *** represent p values less than 0.05, 0.005, and 0.0005, respectively.

