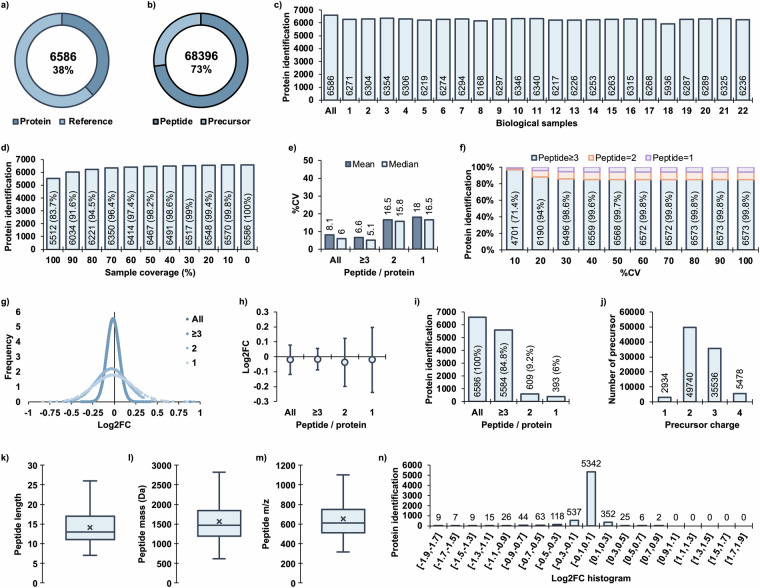
Fig. 2.
Characteristics of retinal proteome quantification. (a) Total quantified unique protein groups in the reference proteome, (b) Total quantified unique peptides in precursors, (c) Number of protein groups quantified in each sample at 1% FDR, (d) Number of protein groups according to sample coverage with missing values, (e) Variance analysis of all quantified proteins and groups of protein quantified with ≥3, 2, and only 1 peptide, (f) Number of proteins at specific %CV thresholds, (g) Normal distribution of each protein fold-change in technical duplicates, (h) Protein fold-change represented as mean ± SD by peptide groups, (i) Number of identified peptides per protein, (j) Precursor charges, (k) Peptide length, (l) Peptide monoisotopic mass, (m) Peptide m/z values, (n) Histogram of protein fold-change.

