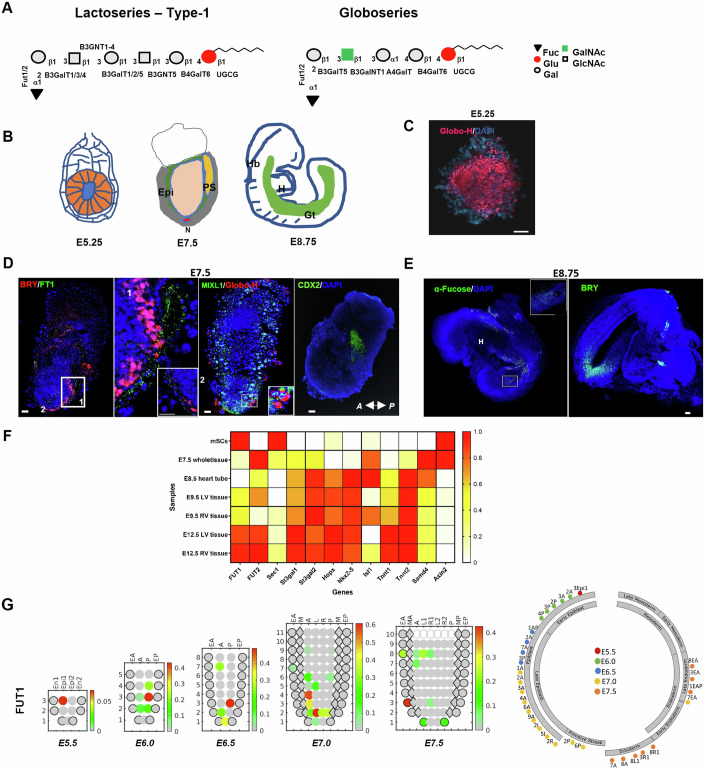
Figure 1. FUT1 expression is reduced during early gastrulation and cardiogenesis.
(A) Symbolic representation of lacto-series type 1 and globo-series showing synthesis consequences with corresponding GTs. The GTs are UGCGT1, B3GalNT1, B3GNT5, B3GalT2, FUT1/FUT2, ST3Gal1/2, and FUT3 (reagents and tools table and Appendix Fig. S2), and the sugar residues are Fuc, fucose; Glu, glucose; Gal, galactose; GalNAc, N-acetylgalactosamine; and GlcNAc, N-acetylglucosamine. (B) Representative whole embryos 5.25, 7.5, and 8.75 days after breeding (E5.25, E7.5, and E8.75, respectively). Abbreviations represent EPI, epiblast; N, notochord; PS, primitive streak; H, heart; Hb, hindbrain; Gt, gut tube. (C) Representative immunofluorescence staining of whole embryo for Globo-H (red) on E5.25. (D) Representative immunofluorescence staining of whole embryo for BRY (red), MIXL1 (green), Globo-H (red), CDX2 (green), mouse FT1 (green) on E7.5. (E) Representative immunofluorescence staining of whole embryo for BRY (green) and FT1 (green) on E8.75. Nuclei are stained with DAPI (blue). (F) Heatmap showing a subset of RNA-seq-based expression profiles of GT genes, cardiac markers, and Wnt- and BMP-responsive genes derived from dataset of mouse stem cells (mSCs), E7.5 whole-tissue embryos, E8.5 heart tube, and E9.5 left ventricle (LV) and right ventricle (RV). Dark orange indicates high expression; white indicates low expression of fold change on logarithmic scale (n = 3 mice). (G) Left: 2D corn plots showing the spatiotemporal expression of FUT1 in E5.5–E7.5 embryos. Right: Circle diagrams demonstrating FUT1 expression according to tissue classification. En1 and En2, divided endoderm; Epi1 and Epi2, divided epiblast; EA, anterior endoderm; EP, posterior endoderm; A, anterior; P, posterior; M, whole mesoderm; L, left lateral; R, right lateral; L1, anterior left lateral; R1, anterior right lateral; L2, posterior left lateral; R2, posterior right lateral; MA, anterior mesoderm; MP, posterior mesoderm. Data information: In (C), scale bar represents 20 μm. In (D, E), scale bars represent 100 μm.

