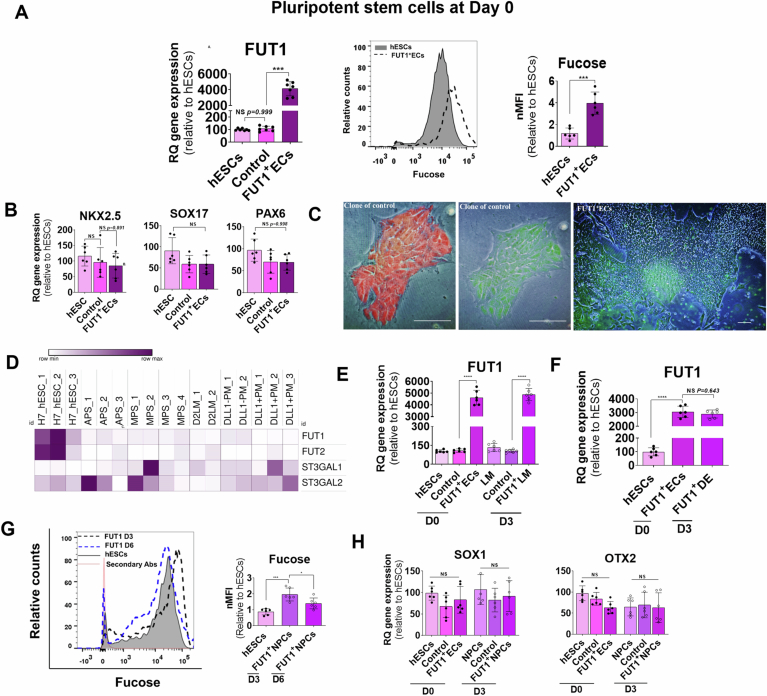
Figure EV4. Continuous expression of FUT1 amplifies the α-fucosyl glycoconjugates and impairs hESC differentiation.
(A) Left: Quantification of FUT1 transcripts in WT, mock-transfected (control ECs), and FUT1-transfected (FUT1+ECs), WA09 hESCs in 3 clones for each line after transfection. Right: Representative histograms showing relative counts and MFI of WT hESCs and FUT1+ECs expressing α-fucose. n = 3 technical replicates for each line. (B) Quantification of representative genes of the tri-germ layers, NKX2.5, SOX17, and PAX6, in WT hESCs and in 3 clones of control ECs and FUT1+ECs for each line showing unchanged genes after transfection. (C) Left and center: Representative brightfield and endogenous fluorescence protein (red, left) and (green, center) images showing clone of control ECs 18 d after culturing sorted cells. Right: Representative bright-field and endogenous fluorescence protein (green) image showing clone of FUT1+ECs 18 d after culturing sorted cells. Scale bars represent 100 μm. n = 3 technical replicates. (D) Heatmap of subset of RNA-seq-based gene expression profiles showing low expression of FUT1 1 d after H7 hESC differentiation into tissues that differentially expressed GT genes. Anterior primitive streak (APS), day 1 mid PS (MPS), and day 2 LM, PM, DLL-, and DLL+, PM cells. n = 3 per group. (E) Quantification of the mRNA expression levels of FUT1 in WT hESCs, control ECs, and FUT1+ECs on day 0 and after differentiation into LM for 3 d showing high and constant expression of FUT1. (F) Quantification of the mRNA expression levels of FUT1 in WT hESCs and FUT1+ECs on day 0 and after differentiation into DE for 3 d showing high and constant expression of FUT1. n = 3 technical replicates. Error bars represent ± SDs. (G) Representative histograms of relative counts and MFI of WT hESCs and FUT1+ECs showing the expression of α-fucose residues in WT hESCs and FUT1+ECs after differentiation into NPCs for 3 d and 6 d. (H) Quantification of NE markers showing SOX1 and OTX2 mRNA expression in WT hESCs, control ECs and FUT1+ECs on day 0 and after differentiation into NPCs for 3 d. In all experiments, n = 3 technical replicates. Data information: In (A, G), data are presented as means ± SD. Ordinary One-way ANOVA **P < 0.01, ***P < 0.001. In (A, B, E, H), data are presented as means ± SEM. Two-tailed Student’s t-tests ****p < 0.0001 or non-significance (NS).

