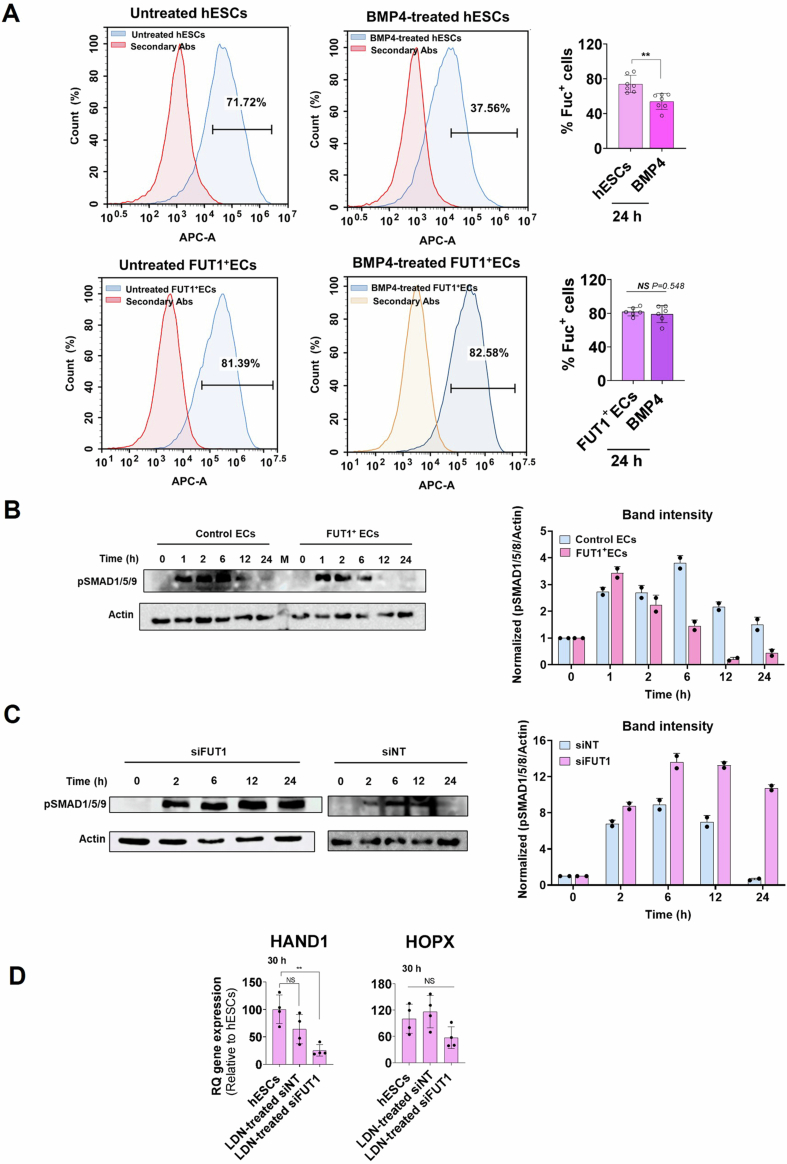
Figure EV5. Constitutive expression of α-fucosyl end groups interferes with BMP signaling.
(A) Top left: Representative histograms showing relative counts of WT hESCs expressing α-fucose residues before and after BMP4 treatment for 24 h. Top right: Quantification of the percent of positive WT hESCs expressing α-fucose residues before and after BMP4 treatment for 24 h. n = 3 clones for each clone n = 2 technical replicates, Bottom left: Representative histograms showing relative counts of FUT1+ECs expressing α-fucose residues before and after BMP4 treatment for 24 h. Bottom right: Quantification of the percent of positive FUT1+ECs expressing α-fucose residues before and after BMP4 treatment for 24 h. n = 3 clones for each clone n = 2 technical replicates. (B) Left: Western blots of pSMAD1/5/8 and β-actin showing a time-course of Smad1/5/8 activity within FUT1+ECs and control ECs after BMP4 stimulation for 24 h. Right: Quantification of the pSMAD1/5/8 intensities. The normalized values are relative to normalized β-actin. n = 2 technical replicates. (C) Left: Western blots of pSMAD1/5/8 and β-actin showing a time-course of Smad1/5/8 activity within silenced FUT1 and siNT cells after BMP4 stimulation for 24 h. Right: Quantification of the pSMAD1/5/8 intensities. The normalized values are relative to normalized β-actin. n = 2 technical replicates. (D) Quantification of HAND1 and HOPX 30 h after FUT1 silencing and 6 h after LDN193189 stimulation in WT, siNT, and siFUT1 hESCs relative to WT hESCs. n = 4 biological replicates. Data information: In (A, D), data are presented as means ± SD. Two-tailed Student’s t-tests **p < 0.01 or non-significance (NS).

