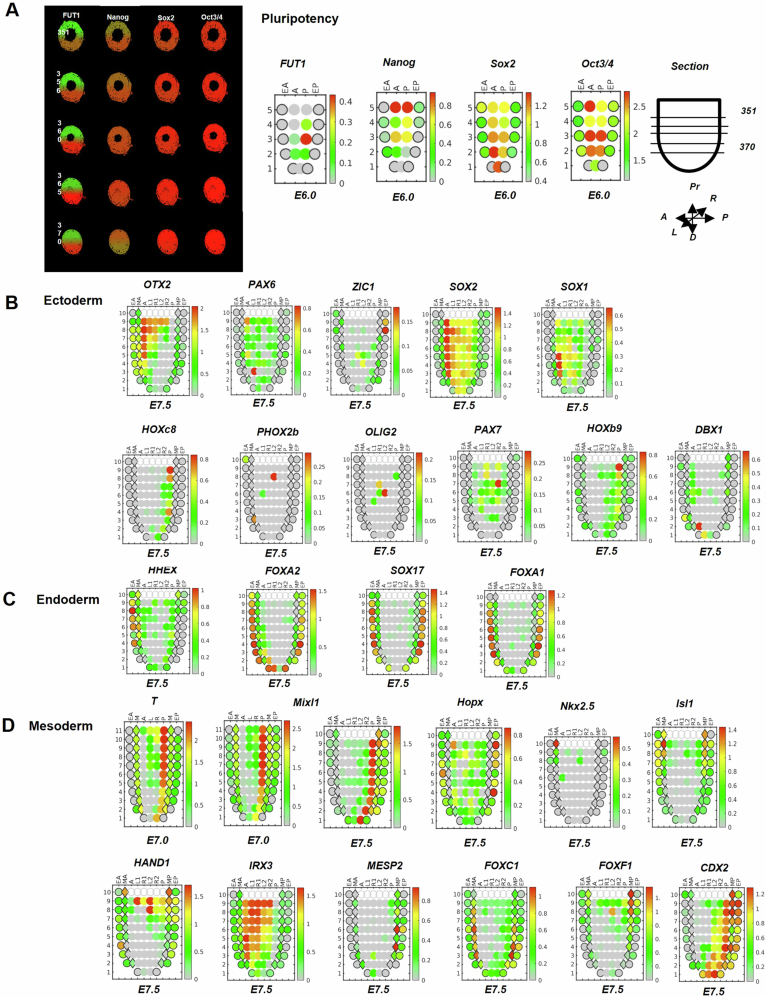
Figure EV1. Co-expression of FUT1 with pluripotency and primary germ layer markers in early embryonic development.
(A) Left: Representative in silico 3D transcriptomic analysis showing co-expression of FUT1 with pluripotent markers (NANOG, SOX2, and OCT3/4) on E6.0 in sections #351–370 from a sequential series of sections. Right: 2D corn plots showing FUT1 and pluripotent gene expression on E6.0. Abbreviations represent A, anterior; P, posterior; L, left; R, right; Pr, proximal; D, distal. (B) 2D corn plots showing the expression of ectoderm markers, OTX2, PAX6, ZIC1, SOX2, SOX1, HOXC8, PHOX2b, OLIG2, PAX7, HOXB9, and DBX1 on E7.5 embryos. (C) 2D corn plots showing the expression of DE markers, HHEX, FOXA2, SOX17, and FOXA1 on E7.5. (D) 2D corn plots showing the spatiotemporal expression mesoderm genes, BRY (T gene) and MIXL1 on E7.0–E7.5; HOPX, NKX2.5, ISL1, HAND1, IRX3, MESP2, FOXC1, FOXF1, and CDX2 on E7.5. 2D and 3D gene expression analysis was obtained by using the database of mouse gastrulation on E5.5–E7.5 (http://egastrulation.sibcb.ac.cn).

