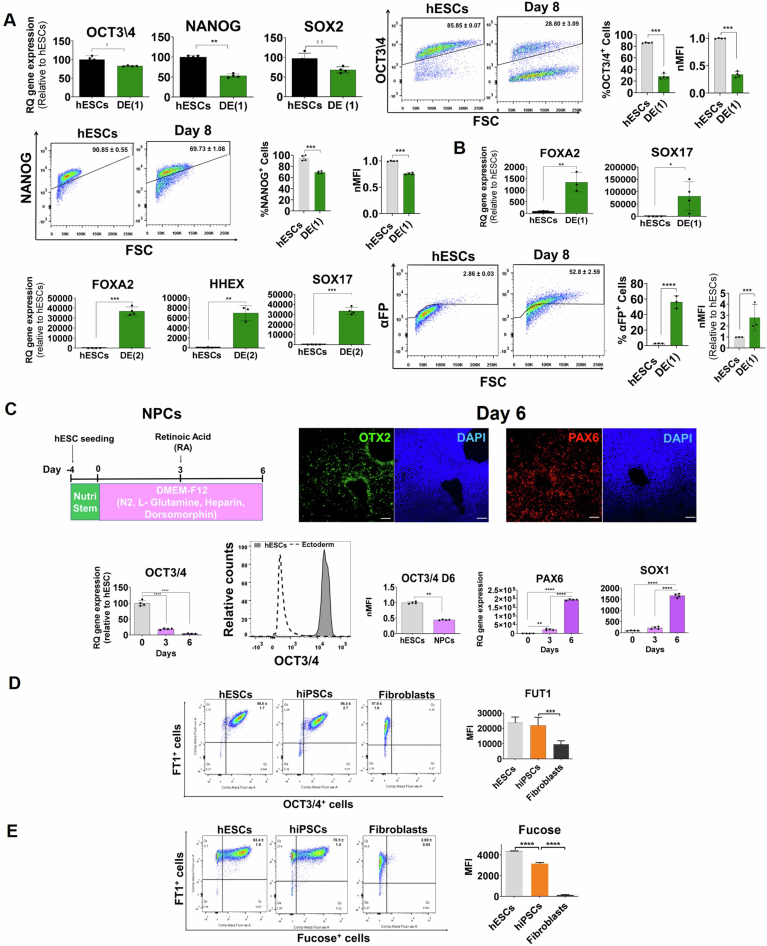
Figure EV2. FUT1 is downregulated during PC differentiation into the tri-germ layer lineages.
(A) Up at left: Quantification of pluripotent gene expression as measured by qPCR. Up at right: Quantification of the percentage of hESCs and hESCs-derived DE on day 8 showing the expression of OCT3/4 in histograms, bar chart, and MFI relative to hESCs. Bottom: Quantification of the percentage of hESCs and hESCs-derived DE on day 8 showing the expression of NANOG in histograms, bar chart, and MFI relative to hESCs. n = 4 technical replicates. (B) Up and bottom at left: Quantification of DE-specific markers, FOXA2 and SOX17 as measured by qPCR after hESC differentiation into DE using protocol 1, and FOXA2, SOX17, and HHEX as measured by qPCR after hESC differentiation into DE using protocol 2 (n = 3 technical replicates). Bottom at right: Quantification of the percentage of hESCs and hESCs-derived DE on day 8 showing the expression of α-FP in histograms and bar chart and MFI relative to hESCs. (C) Up at left: Schematic illustration of hESC differentiation into NPCs via bFGF and RA signaling and BMP inhibition over 6 d. Up at right: Representative immunofluorescent cultures illustrate day 6 NPCs expressing OTX2 (green) and PAX6 (red). Nuclei are stained with DAPI (blue). Scale bars represent 100 μm. Bottom: qRT-PCR and flow cytometry analyses of OCT3/4, PAX6, SOX1. The expression of FUT1 and α-fucose in iPSCs during pluripotency and differentiation is identical to that of hESCs (D) Quantification of the percent of positive cells expressing both the FT1 and OCT3/4 proteins and MFI in hESCs, a pool of hiPSCs and a pool of human fibroblasts. Pooled sample, n = 3 cell lines. n = 3 technical replicates. (E) Quantification of the percent of positive cells expressing FT1 protein and α-fucose residues and MFI in hESCs, a pool of hiPSCs, and a pool of human fibroblasts. Pooled sample, n = 3 cell lines. n = 3 technical replicates. Data information: In qPCR (A, B), data are presented as means ± SD. Two-tailed Student’s t-tests *p < 0.05, **p < 0.01, ***p < 0.001, ****p < 0.0001. In FACS (A–E), data are presented as means ± SD. Ordinary One-way ANOVA **p < 0.01, ***p < 0.001, ****p < 0.0001.

