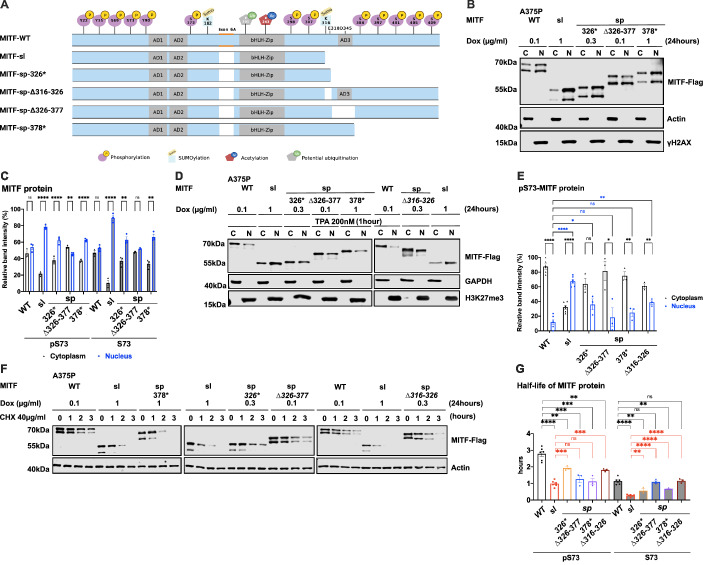
Figure 3. The carboxyl-domains of Mitf control its nuclear localization and stability.
(A) Schematic of MITF-sp truncation constructs. C-term truncations were generated by introducing stop codons at position Q326 or L378 or by deleting fragments 326–377 or 316–326. MITF-sp-326* introduces a stop-codon at residue 326 and, therefore, contains the SUMO-site at 316; MITF-sp-∆326–377 lacks the tentative activation domain AD3; MITF-sp-∆316–326 lacks the SUMO-site and adjacent amino acids; MITF-sp-378* lacks the series of phosphorylation sites at the carboxyl-end of the protein. (B) Western blot analysis of subcellular fractions isolated from A375P melanoma cells induced to overexpress the different MITF mutant proteins fused with Flag-tag at C terminus for 24 h. MITF-WT, MITF-sl, MITF-sp-326*, MITFmi-sp-378*, and MITF-sp-∆326–377 in cytoplasmic (C) and nuclear (N) fractions were visualized using FLAG antibody. Actin and γH2AX were loading controls for cytoplasmic and nuclear fractions, respectively. (C) The intensities of the indicated pS73 MITF and S73 MITF proteins from the cytoplasmic and nuclear fractions of the western blot analysis in (B) were quantified separately with ImageJ software and are depicted as percentages of the total amount of protein present in the two fractions. Error bars represent SEM of three independent experiments. Statistically significant differences were calculated using unpaired Student’s t test. P values for the pS73-MITF form of WT, sl, 326*, ∆326–377, and 378* were 0.1455, <0.0001, 0.0033, 0.0054, and <0.0001. P values for the S73-MITF form of WT, sl, 326*, ∆326–377, and 378* were 0.1302, <0.0001, 0.0072, 0.3957, and 0.0021, respectively. (D) Western blot analysis of subcellular fractions isolated from A375P melanoma cells induced for 24 h to overexpress the different MITF mutant proteins before treatment with TPA at 200 nM for 1 h. MITF-WT, MITF-sl, MITF-sp-326*, MITF-sp-∆326–377, MITF-sp-∆316–326, and MITF-sp-378* protein in cytoplasmic (C) and nuclear (N) fractions were visualized using FLAG antibody. Actin or GAPDH and γH2AX or H3K27me3 were loading controls for cytoplasmic and nuclear fractions, respectively. (E) Intensities of the indicated pS73-MITF proteins from the western blot analysis in (D) in the cytoplasmic and nuclear fractions from the cell treated with TPA were quantified separately with ImageJ software and are depicted as percentages of the total amount of protein present in the two fractions. Error bars represent SEM of three independent experiments. Statistically significant differences were calculated using unpaired Student’s t test. P values for the pS73-MITF form of WT, sl, 326*, ∆326–377, 378*, and ∆316–326 were <0.0001, <0.0001, 0.0573, 0.0258, 0.0025, and 0.0050. P values for the S73-MITF form of sl, 326*, ∆326–377, 378*, and ∆316–326 compared to pS73-MITF-WT in the nuclear fraction were <0.0001, 0.0125, 0.5609, 0.0835, and 0.0019, respectively. (F) Western blot analysis of the MITF proteins from dox-induced A375P cells after treating them with 40 µg/ml CHX for 0, 1, 2, and 3 h. The MITF proteins were visualized by western blot using FLAG antibody. Actin was used as a loading control. The band intensities were quantified using ImageJ software. (G) Half-life analysis of the indicated pS73- and S73-MITF proteins over time after CHX treatment. The MITF protein levels relative to T0 were calculated, and non-linear regression analysis was performed. Error bars represent SEM of at least three independent experiments. Statistically significant differences were calculated using unpaired Student’s t test. P values for the pS73-MITF form of sl, 326*, ∆326–377, 378*, and ∆316–326 compared with pS73-MITF-WT were <0.0001, 0.0093, 0.0008, 0.0004, and 0.0046, respectively. P values for the S73-MITF form of sl, 326*, ∆326–377, 378*, and ∆316–326 compared to S73-MITF-WT were <0.0001, 0.0042, 0.7240, 0.0064, and 0.8886, respectively. P values for the pS73-MITF form of 326*, ∆326–377, 378*, and ∆316–326 compared with pS73-MITF-sl were 0.0001, 0.1748, 0.4561, and 0.0002 respectively. P values for the S73-MITF form of 326*, ∆326–377, 378*, and ∆316–326 compared to S73-MITF-sl were 0.0077, <0.0001, <0.0001, <0.0001, respectively. Source data are available online for this figure.

