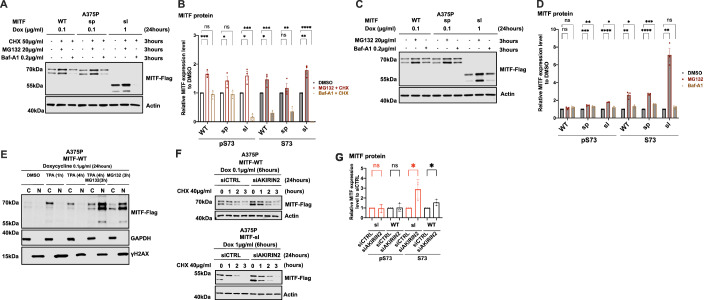
Figure 4. MITF is mainly degraded through the proteasome pathway in the nucleus.
(A) Western blot analysis of the MITF-WT, MITF-sp, and MITF-sl proteins. Expression was induced for 24 h in A375P cells treated with 50 µg/ml CHX in the presence of either DMSO or 20 µg/ml MG132 or 0.2 µg/ml Baf-A1 for 3 h. The MITF protein was then visualized by western blot using FLAG antibody. Actin was used as a loading control. The band intensities were quantified using ImageJ software. (B) The indicated pS73- and S73-MITF protein band intensities from western blot analysis (A) were quantified separately with ImageJ software and are depicted relative to DMSO. Error bars represent SEM of at least three independent experiments. Statistically significant differences were calculated using unpaired Student’s t test. Compared between DMSO and MG132 treated conditions in the presence of CHX, p values for the pS73-MITF form of WT, sp, and sl were 0.0008, 0.0443, and 0.0176, respectively. P values for the S73-MITF form of WT, sp, and sl were 0.0279, 0.3753, and 0.0035, respectively. Compared between DMSO and Baf-A1 treated conditions in the presence of CHX, P values for the pS73-MITF form of WT, sp, and sl were 0.5988, 0.6219, and 0.0003, respectively. P values for the S73-MITF form of WT, sp, and sl were 0.0005, 0.0028, and <0.0001, respectively. (C) Western blot analysis of the MITF-WT, MITF-sp, and MITF-sl proteins. Expression was induced for 24 h in A375P cells treated with either DMSO or 20 µg/ml MG132 or 0.2 µg/ml Baf-A1 for 3 h. The MITF protein was then visualized by western blot using FLAG antibody. Actin was used as a loading control. The band intensities were quantified using ImageJ software. (D) The indicated pS73- and S73-MITF protein band intensities from western blot analysis (C) were quantified separately with ImageJ software and are depicted relative to DMSO. Error bars represent SEM of at least three independent experiments. Statistically significant differences were calculated using unpaired Student’s t test. Compared between DMSO and MG132 treated conditions, P values for the pS73-MITF form of WT, sp, and sl were 0.1532, 0.0007, and <0.0001, respectively. P values for the S73-MITF form of WT, sp, and sl were 0.0026, <0.0001, and 0.0011, respectively. Compared between DMSO and Baf-A1 treated conditions in the presence of CHX, P values for the pS73-MITF form of WT, sp, and sl were 0.0558, 0.0043, and 0.0372, respectively. P values for the S73-MITF form of WT, sp, and sl were 0.0427, 0.0005, and 0.0948, respectively. (E) Western blot analysis of subcellular fractions isolated from A375P melanoma cells induced to overexpress MITF-WT protein before treating with either 200 nM TPA for 1 or 4 h or 40 µg/ml MG132 for 3 h or 200 nM TPA for 1 h and then adding 40 µg/ml MG132 for the next 3 h together with TPA. MITF-WT protein in cytoplasmic (C) and nuclear (N) fractions were visualized using FLAG antibody. GAPDH and γH2AX were loading controls for cytoplasmic and nuclear fractions, respectively. (F) Western blot analysis of the stability of the MITF-WT and MITF-sl mutant proteins after knocking down AKIRIN2, a key regulator of the nuclear import of proteasomes, for 24 h and then inducing MITF expression using dox for 6 h. The inducible A375P cells were treated with 40 µg/ml CHX for 0, 1, 2, and 3 h. The MITF proteins were then visualized by western blot using FLAG antibody. Actin was used as a loading control. The band intensities were quantified using ImageJ software. (G) The intensities of the indicated pS73- and S73-MITF protein bands were quantified from western blot analysis in (F) with ImageJ software and are depicted as relative protein expression to DMSO. Error bars represent SEM of three independent experiments. Statistically significant differences were calculated using unpaired Student’s t test. P values for the pS73-MITF form of WT and sl compared between siCTRL and siAKIRIN2 treated conditions were 0.8860 and 0.8731. P values for the S73-MITF form of WT and sl compared between siCTRL and siAKIRIN2 treated conditions were 0.0293 and 0.0395. Source data are available online for this figure.

