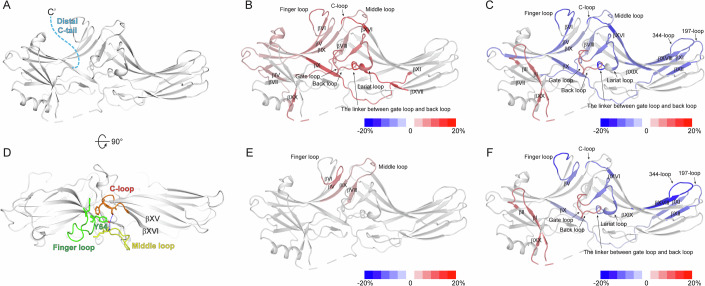
Figure 2. HDX-MS profile analysis of β-arrestin-2 (βarr2)_1-394 and Y64.
(A) The truncated distal C-tail of βarr2 is colored light blue on the basal state structure of βarr2 (PDB: 3P2D) (Data ref:Zhan et al, 2011a; Zhan et al, 2011b). (B) HDX-MS profile comparison between the WT and βarr2_1-394. The HDX-level differences (i.e., HDX levels of WT βarr2–HDX levels of βarr2_1-394) are color-coded on the basal state structure of βarr2 (PDB: 3P2D) (Data ref:Zhan et al, 2011a; Zhan et al, 2011b). Results were derived from three independent experiments (biological). (C) HDX-MS profile comparison between apo and PIP2-bound βarr2_1-394. The HDX-level differences (i.e., HDX levels of apo βarr2_1-394 – HDX levels of PIP2-bound βarr2_1-394) are color-coded on the basal state structure of βarr2 (PDB: 3P2D) (Data ref:Zhan et al, 2011a; Zhan et al, 2011b). Results were derived from three independent experiments (biological). (D) The top-view of the interaction between the finger, middle, and C-loops of βarr2 in the basal state (PDB: 3P2D) (Data ref:Zhan et al, 2011a; Zhan et al, 2011b). Y64 is indicated by green sticks. The finger, middle, and C-loops are green, yellow, and orange, respectively. (E) HDX-MS profiles of the WT and Y64A. HDX-level differences (i.e., HDX levels of WT βarr2–HDX levels of Y64A) are color-coded based on the basal state structure of βarr2 (PDB: 3P2D) (Data ref:Zhan et al, 2011a; Zhan et al, 2011b). Results were derived from three independent experiments (biological). (F) HDX-MS profile comparison of apo- and PIP2-bound Y64A. The HDX-level differences (i.e., HDX levels of apo Y64A–HDX levels of PIP2-bound Y64A) are color-coded based on the basal state structure of βarr2 (PDB: 3P2D) (Data ref:Zhan et al, 2011a; Zhan et al, 2011b). Results were derived from three independent experiments (biological). The color-coded HDX-level differences are based on the maximum differences at any D2O incubation time point. The detailed HDX-MS data are summarized in Dataset EV1 and Figs. EV3 and EV4.

