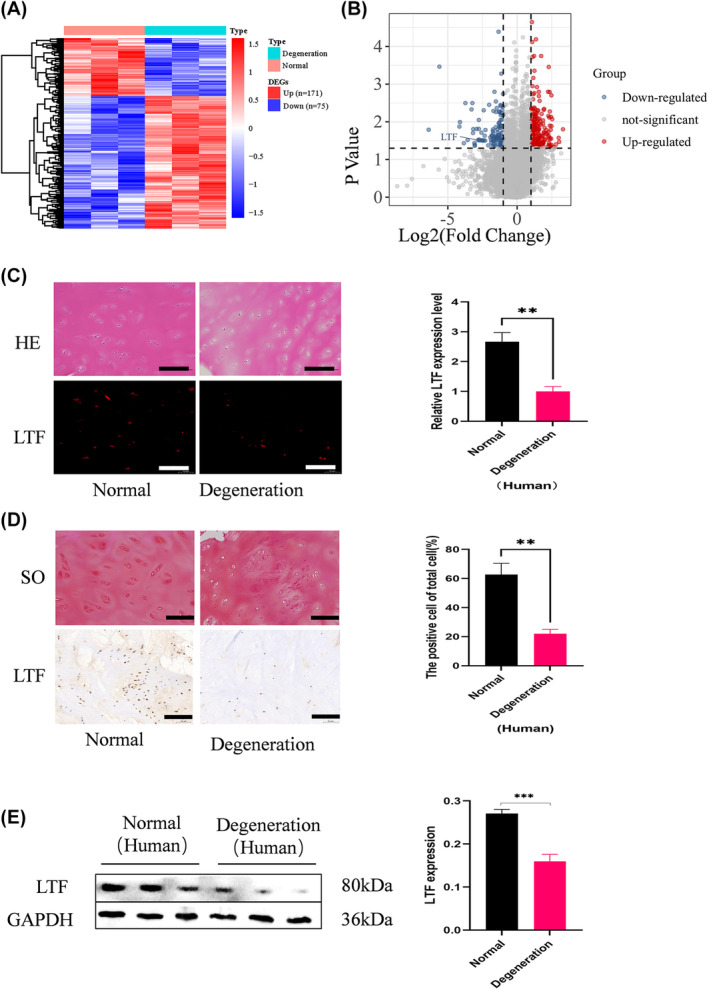
FIGURE 1.

LTF expression decreased in human degenerated CEPs. (A) Heat map of differentially expressed mRNA in the two groups (fold change >2; p < 0.05, 171 vs. 75). (B) Volcano plot showing differentially expressed mRNA with red and blue indicating downregulated and upregulated mRNA, respectively. (C) Representative haematoxylin and eosin staining, IF staining, and LTF quantification in the two human CEP tissue groups. (D) Safranin O staining, IHC staining, and quantification (Scale Bar =100 μm0. (E) WB analysis of LTF protein expression and quantification. All data are expressed as mean ± SD (n = 3); **p < 0.01, ***p < 0.001.
