
FIGURE 3.
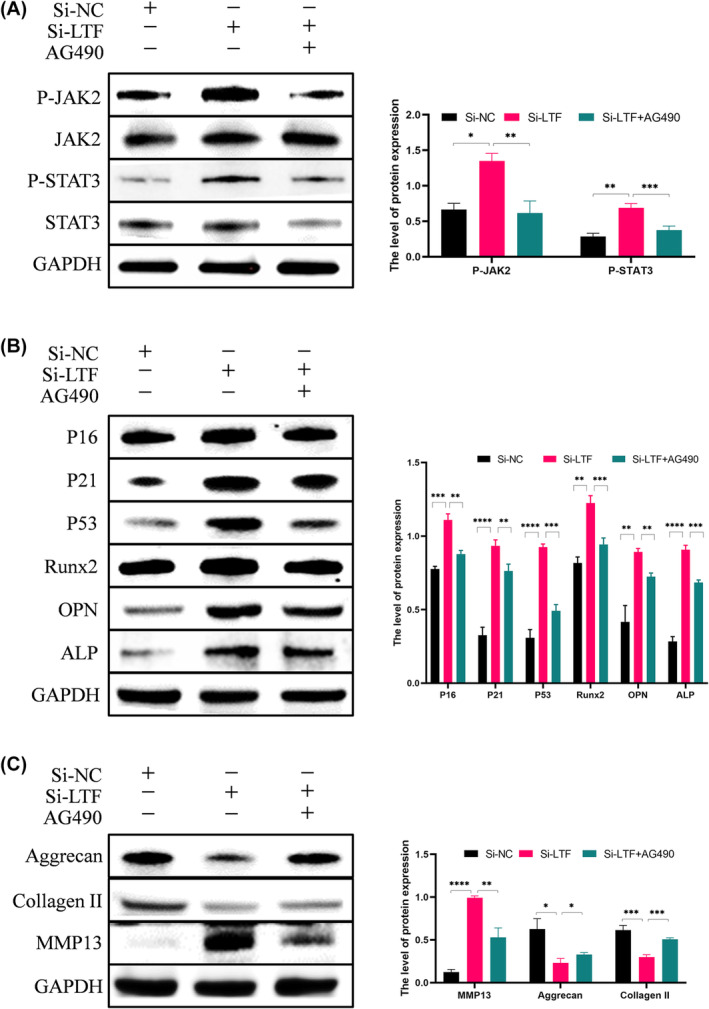
LTF regulates endplate chondrocyte function via the JAK2/STAT3 pathway. (A) WB analysis and quantification of p‐JAK2 and p‐STAT3 levels after si‐NC, si‐LTF and si‐LTF + AG490 treatments. (B) WB analysis and quantification of Runx2, OPN, ALP, P16, P21, and P53 levels in the three groups. (C) WB analysis of MMP13, Collagen II, and Aggrecan levels in different groups. All data are shown as mean ± SD (n = 3); *p < 0.05, **p < 0.01, ***p < 0.001, ****p < 0.0001.