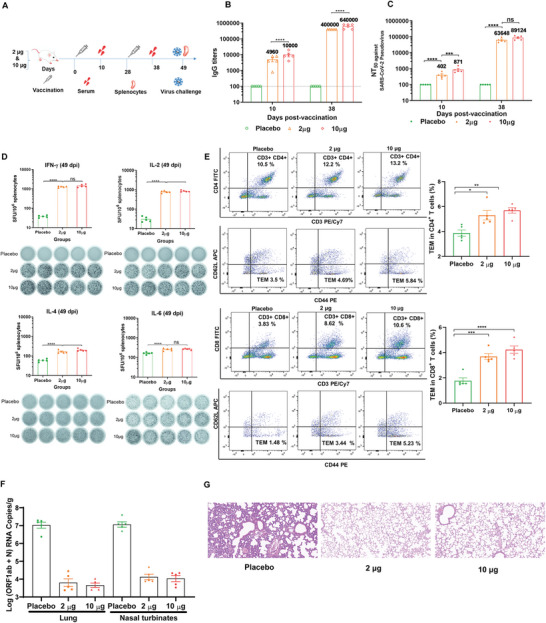
Figure 7.

In vivo immunogenicity and immunoprotection efficacy of YK009‐LNP‐Omicron mRNA. A) Schedule diagram of immunization, sera and spleen collection, and virus challenge. B) ELISA measured the SARS‐CoV‐2 Omicron‐RBD‐specific IgG titers. Significance was calculated by two‐way ANOVA and error bars represent the SEM (n = 5, ****P < 0.0001). C) Neutralization antibody was detected by pseudovirus neutralization assay. Significance was calculated by two‐way ANOVA and error bars represent the SEM (n = 5, ns: no significant difference, ***P < 0.001, ****P < 0.0001). D) ELISpot analysis was performed to detect IFN‐γ, IL‐2, IL‐4, and IL‐6 release among splenocytes after in vivo stimulation with SARS‐CoV‐2 peptide pools. One‐way ANOVA was used to calculate significance and error bars represent the SEM (n = 5, ns: no significant difference, ***P < 0.001, ****P < 0.0001). E) Flow cytometry was performed to detect SARS‐CoV‐2 Omicron RBD‐specific CD4+ and CD8+ effector memory T cells in splenocytes. F) RT‐PCR detected viral RNA loads in the lungs and nasal turbinate of challenged mice. Significance was calculated by one‐way ANOVA and error bars represent the SEM (n = 4, ****P < 0.0001). G) Histopathology of lungs in challenged mice (scale bar = 50 µm).
