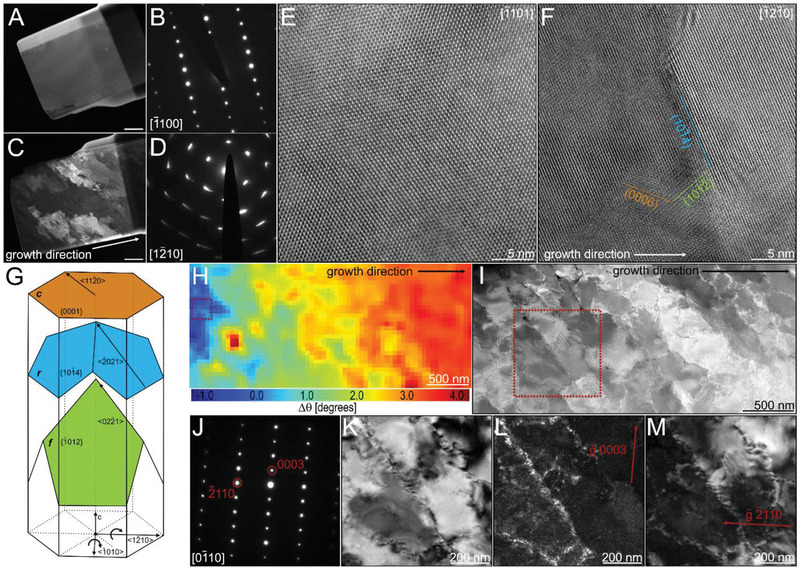
Figure 2.

Dislocation analysis using a high resolution transmission electron microscopy (HRTEM). A,C) Dark‐field images of TEM lamella taken from the prisms of P. nobilis and P. nigra, respectively. Scale bars are 1 µm; and B,D) are the corresponding large area electron diffraction patterns, respectively. E,F) HRTEM images of P. nobilis and P. nigra using the samples in (A) and (C), respectively. Indicated crystal planes were extracted from the corresponding Fourier transforms. Zone axes are indicated in the upper right corner. G) Schematic representation of slip‐systems and basal lattice rotation axes in calcite. H) Misorientation map displaying the change in lattice orientation in P. nigra relative to the area marked by a red rectangle obtained using 4D scanning electron nano‐diffraction microscopy (4D‐STEM) analysis. I) Scanning transmission electron microscopy (STEM) image of the TEM lamella investigated with 4D‐STEM in (H). Red rectangle indicates the area further studied using the two‐beam condition. J) Electron diffraction pattern of the area indicated in (I). K) Bright field image with . L) Dark field image with . M) Dark field image with .
