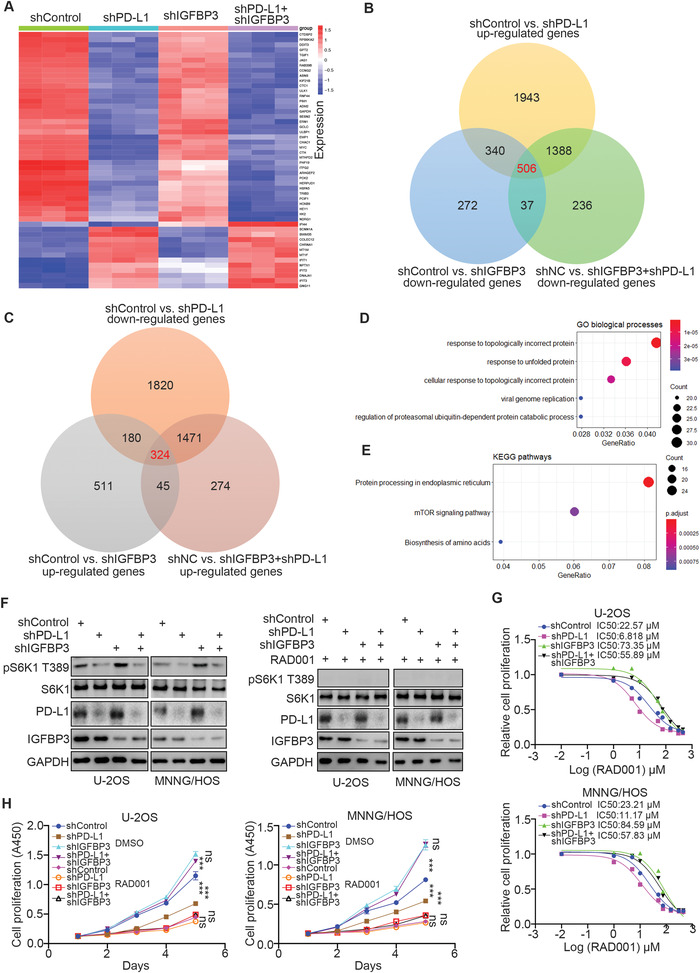
Figure 2.

PD‐L1 activates the mTOR signaling pathway through IGFBP3. A) MNNG/HOS cells were infected with the indicated shRNAs for 72 h. Cells were used for RNA‐seq analysis. B,C) The Venn map indicated the common downstream genes of PD‐L1 and IGFBP3. D,E) GO (D) and KEGG (E) pathway enrichment analyses of the RNA‐seq analysis were performed. F–H) MNNG/HOS and U‐2OS cells were infected with indicated shRNAs for 72 h. These cells were harvested for western blot analysis (F), CCK‐8 assay with different doses of RAD001 to measure the IC50 values of RAD001 (G), or CCK‐8 assay with 20 µm RAD001. Data presented as mean ± SEM with five replicates. Ns, not significant; ***, P< 0.001.
