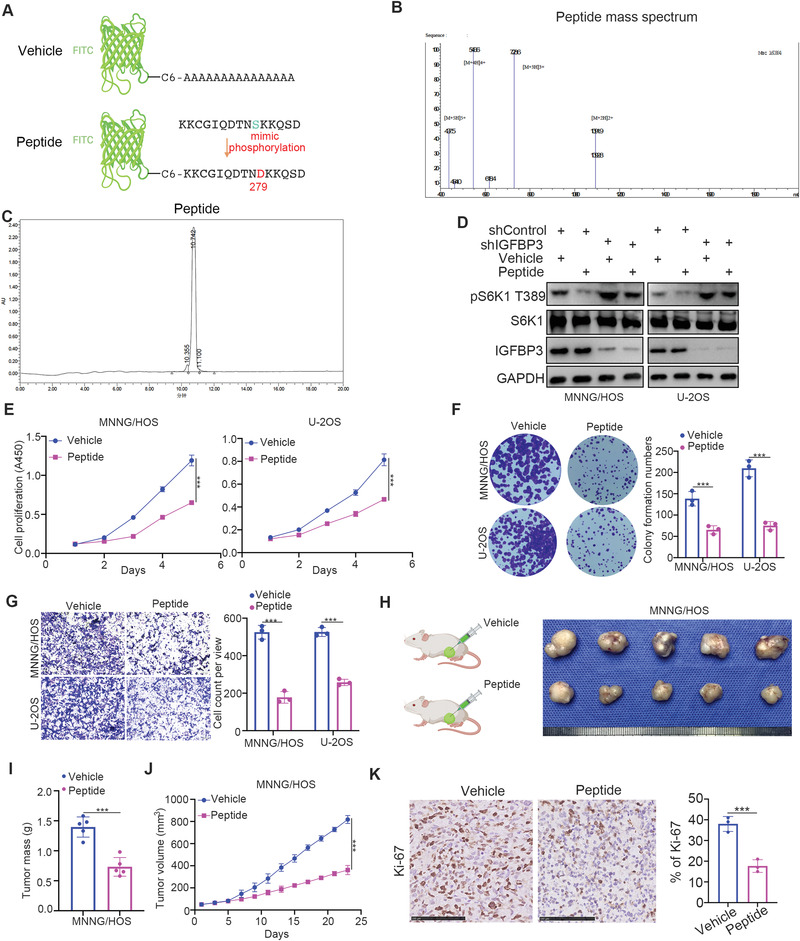
Figure 4.

The PD‐L1‐derived phosphorylation‐mimicking peptide inhibits osteosarcoma cell progression. A) The diagram indicated the peptide of PD‐L1. B,C) the detail of synthesized peptide of PD‐L1. D) MNNG/HOS and U‐2OS cells were infected with the indicated shRNAs for 48 h. Then, cells were treated with or without peptide for 24 h. Cells were harvested for western blot analysis. (vehicle or peptide concentration: 0.05 mg mL−1) E–G) MNNG/HOS and U‐2OS cells were treated with or without peptide. These cells were subjected to CCK‐8 assay (E), colony formation assay (F), and transwell analysis (G). Data presented as mean ± SEM with three replicates. ***, P< 0.001. (vehicle or peptide concentration: 0.05 mg mL−1) H–K) The MNNG/HOS cells were subcutaneously injected into nude mice. Vehicle or peptide was injected into the tumor at day 1, 3,5, 7 (1.2 mg kg−1 every 2 h for 8 h). The tumor image was shown in panel H. The tumor mass was shown in panel I. The tumor volume was shown in panel J. Data presented as mean ± SEM with five replicates. ***, P< 0.001. The Ki‐67 staining was shown in panel K. Data presented as mean ± SEM with three replicates. ***, P< 0.001.
