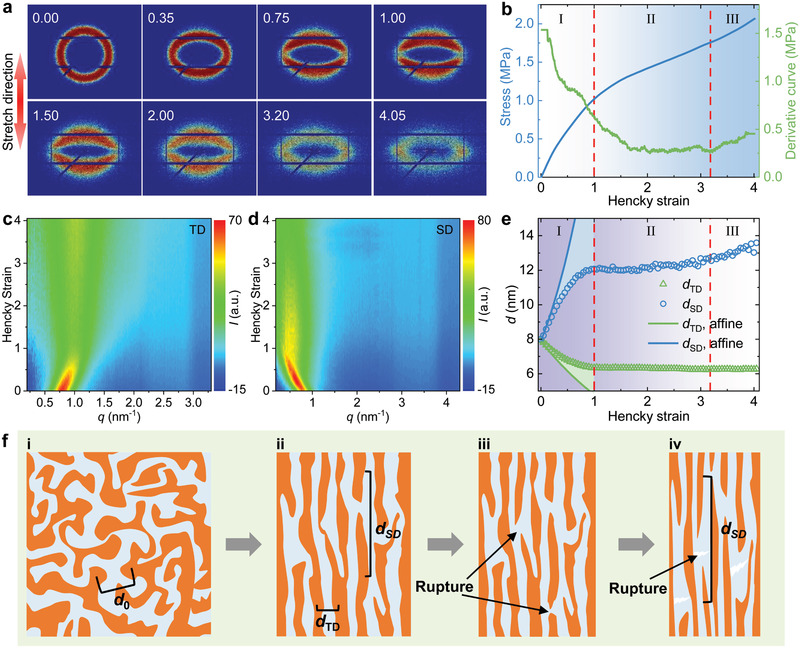
Figure 4.

Revealing the microstructural evolution of a stretched PDUO5000 by in situ SAXS experiments. a) The evolution of the 2D SAXS pattern during sample stretching. The inset numbers correspond to the Hencky strains. b) The monitored stress–Hencky strain and its derivative curves during in situ SAXS experiments. c,d) Contour maps of 1D integrated SAXS curves (Figure S19c,d, Supporting Information) in the transverse direction (TD) and the stretch direction (SD), respectively. Upon stretching, the peak along TD moves to a higher scattering vector (q) and then stays at ≈1 nm–1, while its intensity first decreases and then increases slightly. This is consistent with the evolution of the 2D pattern (Figure 4c; Figure S19c, Supporting Information). The peak along SD moves to low q value and then stays at ≈0.5 nm–1, while its intensity initially increases followed by a decrease during stretching (Figure 4d; Figure S19d, Supporting Information). e) The change of interdomain distance along the TD (d TD) and SD (d SD) with the Hencky strain. The solid blue and green curves indicate the affine deformations for an incompressible material (Supporting Information). f) Schematic of the arrangement of PDUO5000 under different strains. Before stretching, the HB domains (orange) and PDMS‐rich phase (light blue) form a bicontinuous network (i). At the end of zone I, the HB domains align along the SD (ii). After zone I, the rupture of HB domains occurs (iii). When the strain reaches a threshold, the rupture of the PDMS‐rich phase occurs (iv).
