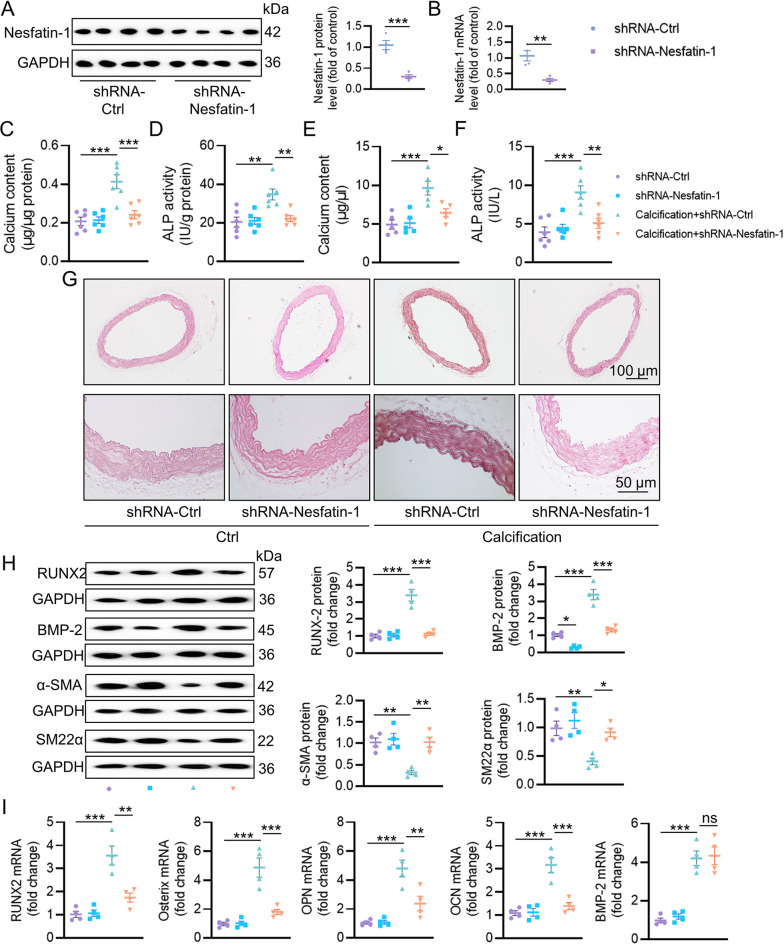
Fig. 2.
Effects of nesfatin-1 knockdown on the progression of VC in VD3-induced mice. (A) Western blot analysis of nesfatin-1 protein levels in aortas. (B) RT-PCR analysis of nesfatin-1 mRNA levels in aortas. (C) Calcium content. (D) ALP activity. (E) Serum calcium content. (F) Serum ALP activity. (G) Representative Alizarin red S staining of aortas. Scale bar, 100 μm–50 μm. (H) Western blot analysis of RUNX2, BMP-2, α-SMA and SM22α. (I) RT-PCR analysis of RUNX2, Osterix, OPN, OCN, and BMP-2. The P-value was calculated by unpaired two-tailed Student’s t-test (A-B). Differences between groups were assessed with ANOVA followed by Bonferroni post-hoc test (C-I). *P < 0.05, **P < 0.01, ***P < 0.001 versus the indicated group. n = 6

