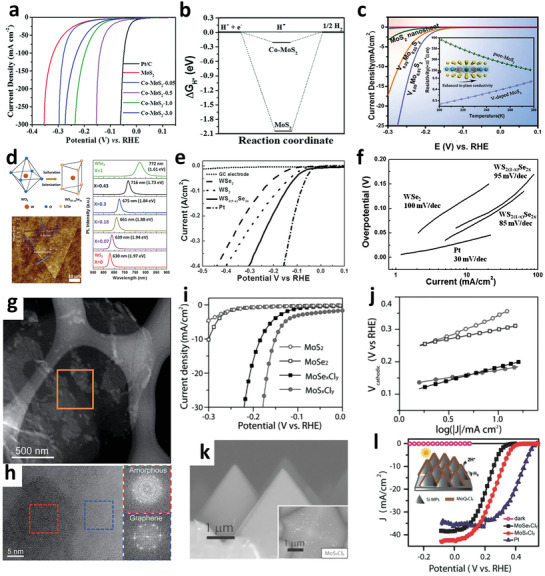
Figure 7.

a) LSV curves of HER and b) the calculated of pure MoS2 and Co‐doped MoS2. a,b) Reproduced with permission.[ 164 ] Copyright 2018, Royal Society of Chemistry. c) LSV curves of pure and V‐doped MoS2 NSs. Inset: demonstrated temperature‐dependent resistivity of V‐doped MoS2 NSs. Reproduced with permission.[ 161 ] Copyright 2014, Royal Society of Chemistry. d) Preparation of hexagonal WS2(1− x )Se2 x through simultaneous selenization and sulfurization reaction of monoclinic WO3. The room‐temperature PL spectra and the corresponding AFM image of the prepared WS2(1− x )Se2 x NS. e) Comparison for HER catalytic activity for Pt, GC, monolayer WS2, WSe2, and WS2(1− x )Se2 x (x = 0.43). f) The corresponding Tafel slope value. d–f) Reproduced with permission.[ 157 ] Copyright 2015, Wiley‐VCH. g) EDS element mapping of a monolayer graphene NS that was partially covered by MoS x Cl y . h) HRTEM and local FFT image of a MoS x Cl y –VG sheet. g,h) Reproduced with permission.[ 72 ] Copyright 2015, Royal Society of Chemistry. i) HER performance and j) their corresponding Tafel plot of MoS x Cl y , MoSe x Cl y , MoS2, and MoSe2. k) Cross‐sectional and top to down (inset) SEM images of MoS x Cl y /Si MPs. l) PEC‐HER performance of MoSe x Cl y /Si MPs (squares), MoS x Cl y /Si MPs (circles), and Pt/Si MPs (triangles) photocathodes. The experiments were conducted in 0.5 M H2SO4 under 1 Sun irradiation. i–l) Reproduced with permission.[ 30 ] Copyright 2015, Wiley‐VCH.
