
Figure 8.
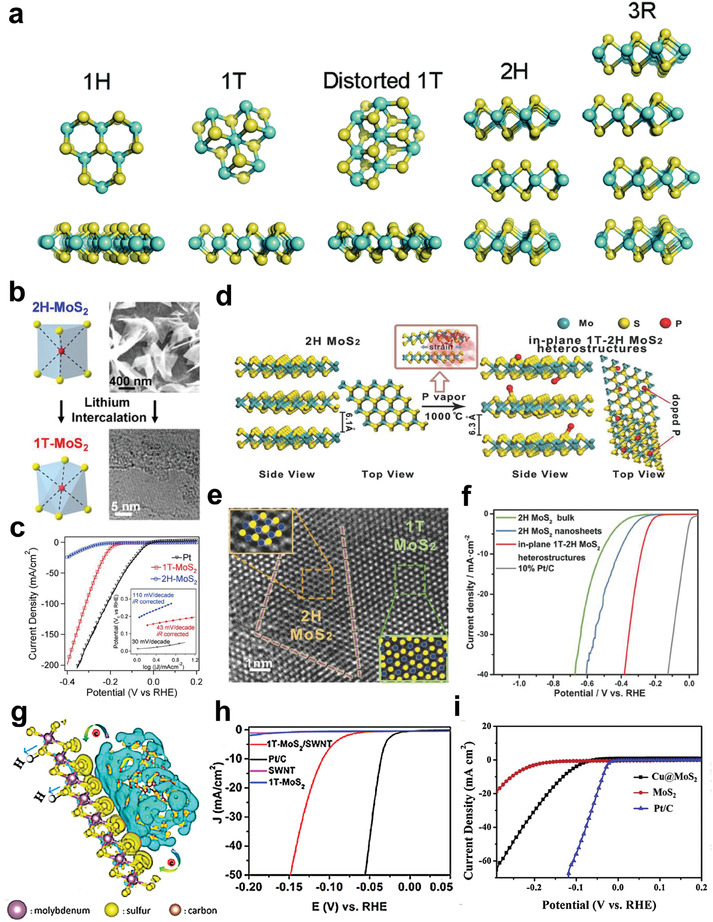
a) Different crystal structures of TMDs, from left to right: 1H phase, ideal 1T phase, 1T′ phase (which is actually the distorted 1T phase), 2H phase, and 3R phase. Reproduced with permission.[ 167 ] Copyright 2015, Royal Society of Chemistry. b) Lithium‐intercalation‐triggered phase transform of MoS2 (2H to 1T phase), and c) comparison of HER performance for the two different electrocatalysts. b,c) Reproduced with permission.[ 85 ] Copyright 2013, American Chemical Society. d) Preparation process of the partial transformed MoS2 NSs, which was induced by doping with phosphorus atoms. e) HRTEM image of in‐plane heterostructures in MoS2 NSs with f) LSV curves for MoS2 with in‐plane 1T‐2H heterostructures, 2H MoS2 bulk, 2H MoS2 NSs, and 10% Pt/C. d–f) Reproduced with permission.[ 175 ] Copyright 2018, Wiley‐VCH. g) Calculated charge density distribution around the 1T MoS2 and SWNT interface. The yellow area represents the electrons gathering, while the blue area represents electrons losing area, respectively. h) HER performance of commercial Pt catalyst, 1T MoS2/SWNT heterostructure, SWNT, and 1T MoS2. g,h) Reproduced with permission.[ 176 ] Copyright 2017, American Chemical Society. i) LSV curves of commercial Pt/C, MoS2 and single Cu atom doped MoS2. Reproduced with permission.[ 177 ] Copyright 2019, Elsevier.