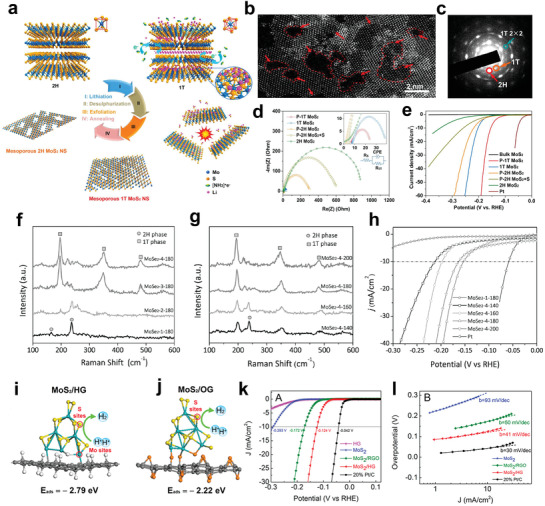
Figure 10.

a) Diagram for the preparation process of 2H MoS2, 1T MoS2, P‐2H MoS2, P‐1T MoS2, and P‐2H MoS2+S. b) HR‐STEM and c) SAED pattern of P‐1T MoS2 NSs. d) The electrochemical impedance spectroscopy Nyquist plots and e) HER performance of various MoS2 samples. a–e) Reproduced with permission.[ 20 ] Copyright 2016, American Chemical Society. f) The comparison of Raman spectra for MoSe2 NSs prepared with different amounts of NaBH4 at 180 °C. g) Raman spectra of the MoSe2 NSs synthesized under different temperatures with the same amount of NaBH4. h) HER activities of various MoSe2 samples synergistically modified by phase and disorder engineer. f–h) Reproduced with permission.[ 27 ] Copyright 2018, Wiley‐VCH. i–j) The DFT calculation result of hydrogen adsorption energy at S edge sites of MoS2 on HG and OG. k) LSV curve of different MoS2 electrocatalysts and l) their Tafel slops. i–l) Reproduced with permission.[ 216 ] Copyright 2018, American Chemical Society.
