
Figure 9.
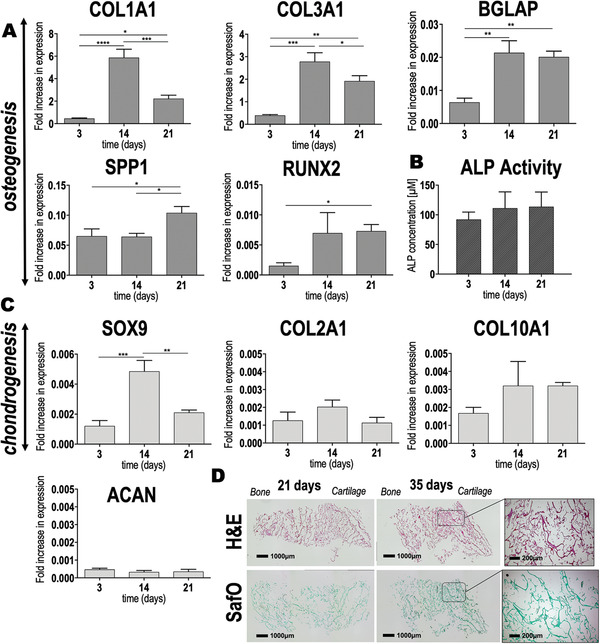
Spatial‐specific gene expression and matrix deposition of hAMSCs after seeding on the chitosan‐collagen‐octacalcium phosphate scaffolds. A) Expression of osteogenic markers (COL1A1, BGLAP, SPP1, and RUNX2) and matrix‐related fibrillar COL3A1 were assayed by qRT‐PCR after 3, 14, and 21 days of hAMSC culture on the scaffolds. Results are normalized to the housekeeper TUBB. Obtained p values are indicated as * p ≤ 0.0418, ** p ≤ 0.0034, *** p ≤ 0.0007, and **** p < 0.0001. B) ALP activity as determined by colorimetric assay (p > 0.05). C) Expression of chondrogenic markers (SOX9, COL2A1, COL10A1, and ACAN) assayed by qRT‐PCR after 3, 14, and 21 days of cell culture, was normalized to the housekeeper TUBB. Results showed statistical significance only for SOX9 (** p = 0.0022 and *** p = 0.0005). D) H&E and SafO staining of the entire scaffold after extended culture time (i.e., 21 and 35 days of cell culture). Scale bar = 1000 µm. Dashed squares represent the area of the scaffolds where higher magnification images were taken. Scale bar = 200 µm. All data are shown as mean value ± standard deviation. One‐way ANOVA followed by a Tukey's correction was performed for multiple comparisons. Experiments were performed in triplicate (technical replicates = 3).