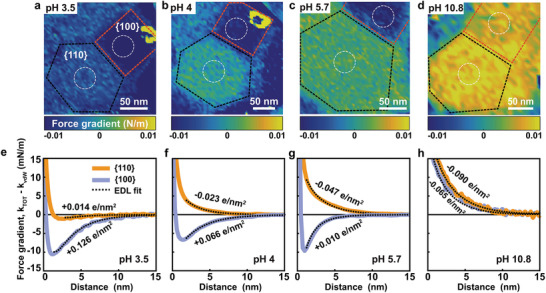
Figure 2.

Atomic force microscopy (AFM) of SrTiO3 nanoparticles. a–d) Color‐coded 2D force maps showing tip–sample interaction (k TOT) forces on the SrTiO3 nanoparticle facets in 10 × 10−3 m NaCl solution at a) pH 3.5, b) pH 4, c) pH 5.7, and d) pH 10.8 (blue: attractive force; yellow: repulsive force). Note: The maps are shown at 2 nm distance from the SrTiO3 nanoparticle surface. All force maps are recorded on the same SrTiO3 particle with the same probe (tip parameters: Q factor = 3.3; resonance frequency = 25.368 kHz; spring constant = 1.02 N m−1; tip radius = 13.9 ± 2 nm; see the Experimental Section for details). Topography image corresponding to the force maps are shown in Figure S5 (Supporting Information). e‐h) The force gradient versus distance after subtraction of van der Waals force averaged over white encircled areas in (a)–(d). Solid lines: orange – center of on {110} facet; blue – center of {100} facet. Dotted black lines are the theoretically fitted force curves using EDL theory with charge regulation boundary condition. Orientations of the local surface normal on {100} and {110} are ≈10° and 30°, respectively. The total interaction stiffness and DVLO is shown in Figure S5 (Supporting Information).
