Figure 4.

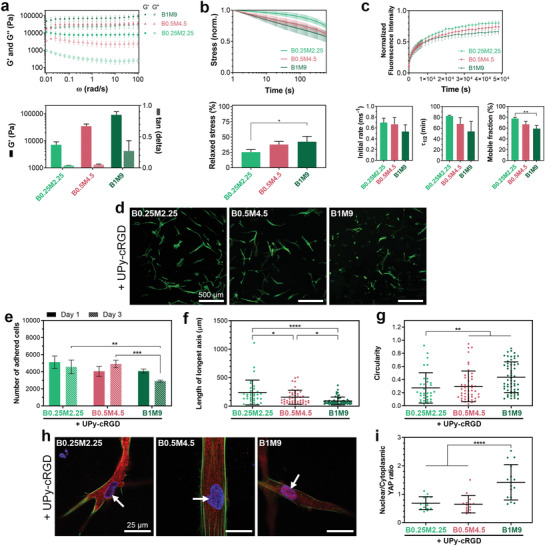
Concentration‐dependent behavior of hydrogels. a) Frequency dependence of viscoelastic behavior, and quantified storage moduli (G′) and tan(delta) values (at 1 rad s−1 and 1% strain) of hydrogels with different total polymer concentrations and a fixed M/B ratio. b) Stress relaxation behavior of supramolecular hydrogels measured by subjecting the hydrogels to 1% strain. c) Fluorescence recovery after photo‐bleaching (FRAP) tests performed on hydrogels containing 20 µm of UPy‐Cy5 additives. Quantified results show the rate of fluorescence recovery during the first 60 s after photo‐bleaching (Initial rate), the timespan during which the fluorescence intensity recovers to half its mobile fraction (τ1/2), and the fraction of fluorescence intensity that recovers when fluorescence intensity curves reach plateau values (Mobile fraction). a–c) All measurements were performed at 37 °C. d) Representative images of HVSCs after 1 day of culture on hydrogels with different polymer concentrations. Green color in images indicates actin staining. e) Number of cells adhered onto hydrogel surfaces after 1 and 3 days of culture. f) Length of longest axis and g) circularity of cells after 1 day of culture on supramolecular hydrogels. h) Representative images of HVSCs upon immunofluorescence staining for nucleus (blue), actin (green), and YAP (red) after 1 day of culture on hydrogels with different polymer concentrations. Arrows indicate the nuclei. i) Quantification of the nuclear/cytoplasmic ratio of the YAP concentration in cells after 1 day of culture. d–i) Hydrogels contained 3 mm of UPy‐cRGD additives. b,c,e,f,g,i) *, p < 0.05; **, p < 0.01; ***, p ≤ 0.001; ****, p ≤ 0.0001; one‐way (b,c,f,g,i) or two‐way (e) analysis of variance (ANOVA) followed by Bonferroni post hoc. All results were obtained from three to four independent experiments per group, and all values are shown as mean ± s.d. f,g,i) Data points represent features of individual cells, with n comprising the total number of cells per group that were detectable/analyzed among three experiments.
