Figure 6.

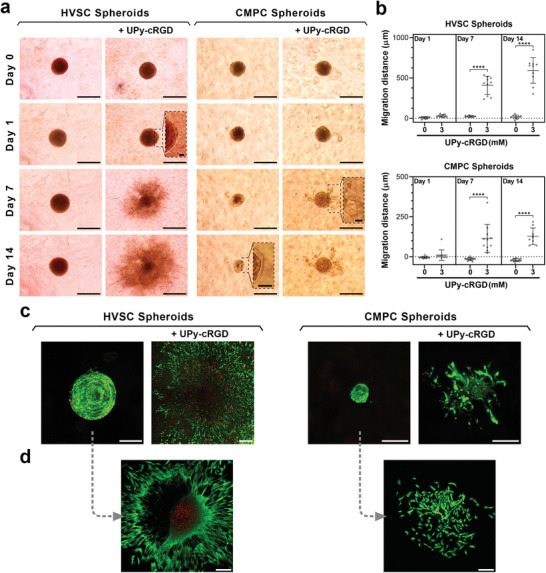
Multicellular spheroids encapsulated in supramolecular hydrogels. a) Representative images of HVSC and CMPC spheroids encapsulated in supramolecular hydrogels without or with 3 mm of UPy‐cRGD additives. Scale bars = 500 µm (main images of HVSC spheroids), 250 µm (main images of CMPC spheroids), and 50 µm (insets). b) Quantification of migration distance of cells from the initial surface of spheroids into hydrogel matrices. ****, p ≤ 0.0001; one‐way analysis of variance (ANOVA) followed by Bonferroni post hoc. Results were obtained from four biologically independent experiments per group, and the values are shown as mean ± s.d. Data points represent cell migration distance from initial spheroid surface, with n comprising the total number of spheroids per group that were detectable/analyzed among four experiments. c) Representative images of HVSC and CMPC spheroids after 14 days of culture in supramolecular hydrogels without or with 3 mm of UPy‐cRGD additives. d) Representative images of HVSC and CMPC cells after 2 days of culture of spheroids extracted from hydrogels without UPy‐cRGD. c,d) Green and red colors indicate live and dead cells, respectively; Scale bars = 200 µm. a–d) All hydrogels were of B0.25M2.25 composition.
