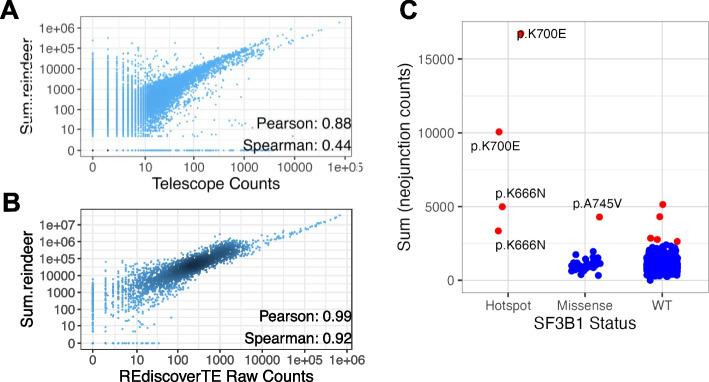
Fig. 4.
Quantification of transposable elements and novel splice junctions. A Correlation of quantification of 1000 ERVs by Reindeer and Telescope, in 56 colon cell lines from CCLE. B Correlation of quantification of 50 ERV families by Reindeer and RediscoverTE, in 56 colon cell lines from CCLE. C Quantification of SF3B1-induced neojunctions in cell lines. Each dot represents the sum of counts of 849 SF3B1-induced neojunctions in one CCLE cell line. Cell lines harboring hotspot (likely oncogenic) SF3B1 mutations, other missense SF3B1 mutations and wild-type SF3B1 are distinguished. Cell lines with outlier neojunction expression (> 2 SD above mean) are shown in red

