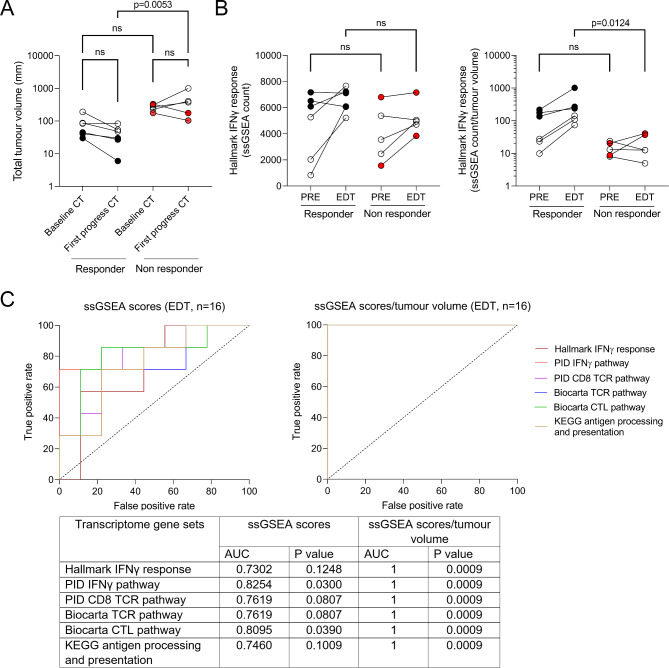
Fig. 2.
Comparison of tumour volume and transcriptomic signatures in 11 matched PRE-EDT tumour biopsies. A) Change in total tumour volume from baseline and first progress CT imaging in responders and non-responders. Black coloured circles indicate tumours with < 50 mm in sum diameter at baseline, red coloured circles indicate the two non-responders with initial PR but PFS < 6 months, Kruskal-Wallis test with Dunn’s multiple comparisons, p = 0.0053. B) Change in expression of the Hallmark IFNγ response gene set (left) and the tumour-normalised Hallmark IFNγ response gene set (right) in matched PRE-EDT samples (n = 11, n = 6 responders, n = 5 non-responders). Black coloured circles indicate tumours with < 50 mm in sum diameter at baseline, red coloured circles indicate the two non-responders with initial PR but PFS < 6 months, Kruskal-Wallis test with Dunn’s multiple comparisons, p = 0.0124. C) ROC curve analysis of IFNγ-related and immune-associated transcriptomic signatures with and without tumour volume normalisation (ssGSEA scores divided by total tumour volume) in melanoma tumours early during treatment (EDT) with combination ICIs (n = 16)

