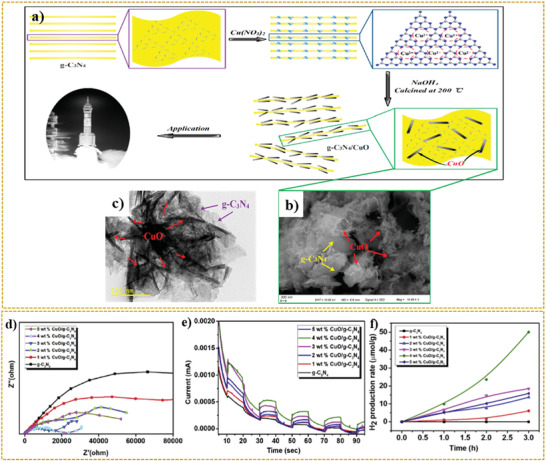
Figure 10.

a) Schematic representation of the g‐C3N4/CuO nanocomposite formation. b) SEM and c) TEM images of g‐C3N4/CuO nanocomposite. d) Nyquist plots of EIS measurements, e) amperometric I–t curves, and f) photocatalytic H2 production activity for g‐C3N4 and g‐C3N4/CuO nanocomposites with various %CuO loaded photocatalysts. a–c) Reproduced under the terms of the CC‐BY Creative Commons Attribution 4.0 International license (https://creativecommons/licenses/by/4.0).[ 304 ] Copyright 2020, The Authors, published by MDPI. d–f) Reproduced with permission.[ 307 ] Copyright 2020, Elsevier.
