Figure 1.

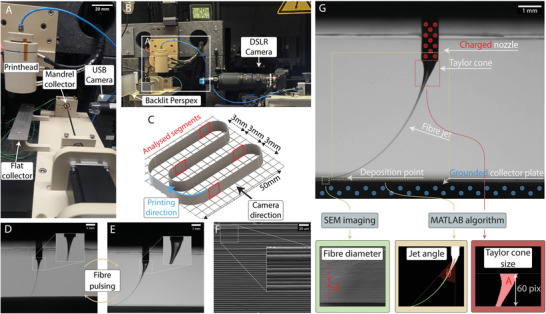
A) MEW printer consisting of both a flat and mandrel collector. B) The high‐resolution camera is positioned out of field and behind the USB camera that is used for approximate positioning. C) Schematic of the experimental design, so that the exact timing of the MV can be correlated with fiber diameter measurements. D,E) Photographs of the MEW jet during fiber pulsing phenomenon with: D) a small Taylor cone volume associated with a smaller fiber diameter, that oscillates to E) a large Taylor cone volume, which results in larger fiber diameters and greater fiber jet lag. F) SEM imaging of the fiber wall showing the result of uncontrolled oscillating from (D) to (E) where different fiber diameters result. G) A single frame is captured from the video recording of the process, to analyze the process signatures of MEW. The fiber diameter is measured using SEM, while the jet angle and Taylor cone area are computed by analyzing specific regions using MATLAB.
