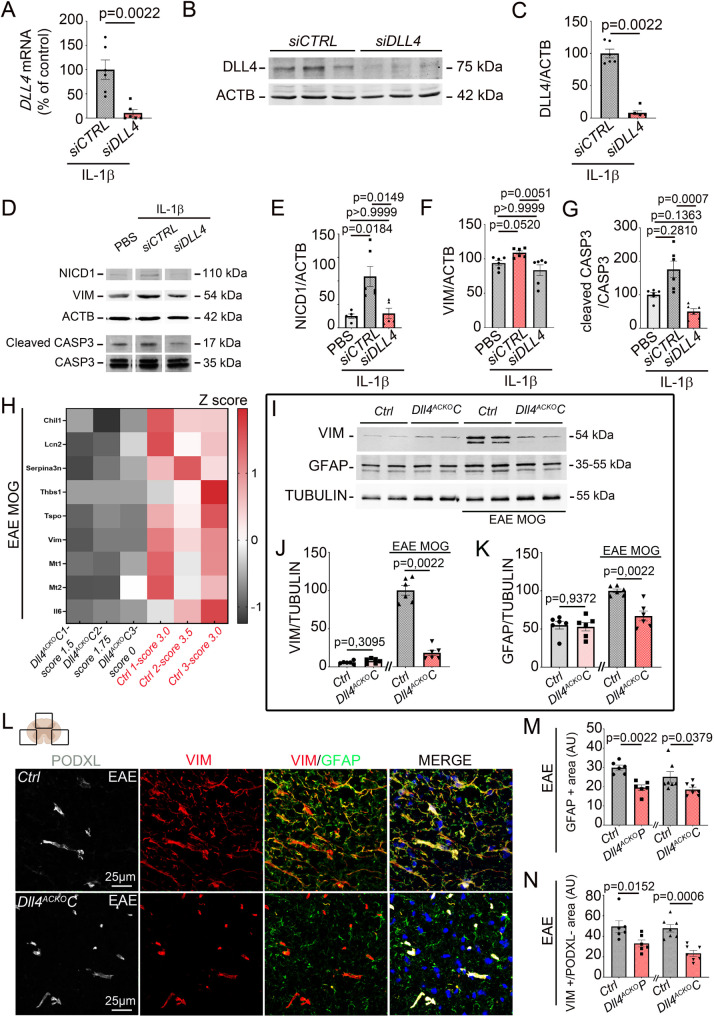
Fig. 3.
Astrocyte-specific Dll4 inactivation induces downregulation of astrocyte reactivity under neuroinflammatory condition. (A-G) NA were transfected with a CONTROL siRNA (20µM) versus a DLL4 siRNA (20 µM) and treated with IL-1β 10ng/mL for 12 h. (A-C) DLL4 expression was quantified by (A) qRT-PCR (n = 6) and (B-C) WB. β-ACTIN (ACTB) was used as a reference. (B) Representative WB for DLL4 and ACTB protein expression are shown. (C) DLL4 protein expression was quantified. (n = 6). (D-E) NICD1, (D, F) VIM, (D, G) cleaved-CASP3 expression were quantified by WB. ACTB and CASP3 total were used as references. (n = 6) (H) Transcriptional RNA profiling of astrocyte lysates from EAE induced Dll4ACKOC mice and control littermates was performed. A Heatmap of the differentially expressed genes involved in astrocyte reactivity [28] is shown. (I-K) VIM and GFAP protein expression were quantified by WB in spinal cord lysates from Freund adjuvant or EAE-induced Dll4ACKOC mice and control littermates (at 18 days post induction). TUBULIN was used as a reference. (I) Representative WB for VIM, GFAP and TUBULIN are shown. (J-K) VIM and GFAP protein expression were quantified by WB. TUBULIN was used as a reference. (Dll4ACKOP mice n = 6, WT n = 6) (Dll4ACKOC mice n = 6, WT n = 6) (L-N) Spinal cord EAE lesions from Dll4ACKOP mice, Dll4ACKOC mice and littermate controls were harvested at 18 days post induction and immuno-stained with anti-GFAP (in green), anti-VIM (in red) and anti Podocalyxin (PODXL) (in grey) (to discriminate vascular from astrocytic VIM expression) antibodies. Nuclei were stained with DAPI (in blue). (L) Dll4ACKOC mice versus control tissues are shown. (M) GFAP + and (N) VIM+/PODXL- areas were quantified (Dll4ACKOP mice n = 6, WT n = 6) (Dll4ACKOC mice n = 7, WT n = 7)). Statistical significance was determined by using a Mann-Whitney U test or Kruskal Wallis test followed by the Dunn’s multiple comparison test

