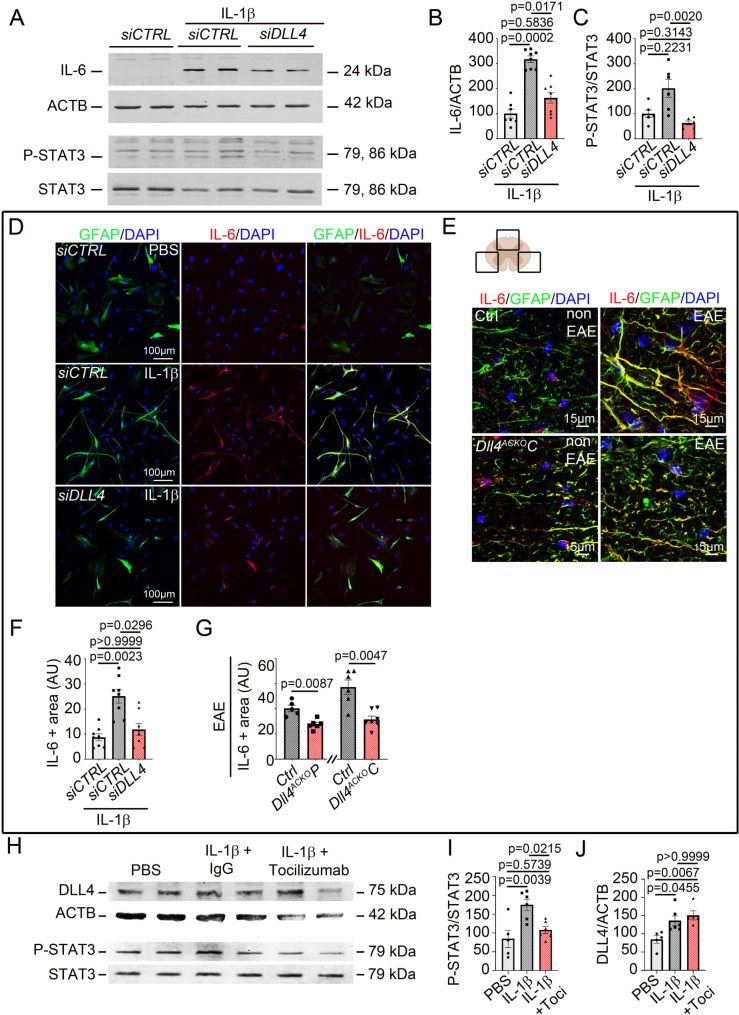
Fig. 5.
Astrocyte-specific Dll4 inactivation induces downregulation of astrocyte reactivity through the downregulation of the IL-6-STAT3 pathway. (A-C) NA were cultured until 70% confluence and transfected with a CONTROL siRNA (20 µM) versus a DLL4 siRNA (20 µM), starved for 12 h and treated with 1X PBS versus IL-1β 10ng/mL for 12 h. (A-B) IL-6 (n = 8) and (A, C) P-STAT3 (n = 6) expression were quantified by western blot (WB). β-ACTIN (ACTB) and STAT3 total were used as references. (D) NA were cultured on Lab-Tek® until 70% of confluence. They were then treated as above. GFAP (in green) and IL-6 (in red) localizations were evaluated by immuno-fluorescent staining. Nuclei were stained with DAPI (in blue). (E) Spinal cord from control tissues or EAE lesions (18 days post induction) from Dll4ACKOP mice, Dll4ACKOC mice and littermate controls were harvested. Dll4ACKOP, Dll4ACKOC and control tissues were immuno-stained with anti-GFAP (in green) and anti-IL-6 (in red) antibodies. Nuclei were stained with DAPI (in blue). Dll4ACKOC and control tissues are shown. (F-G) IL-6 positive areas were quantified (F) in reactive NA (n = 8) and (G) in spinal cord lesions (3 lesions per tissue) (Dll4ACKOP mice n = 6, WT n = 5) (Dll4ACKOC mice n = 7, WT n = 6)). (H-J) NA were cultured until 70% confluence. They were then starved for 12 h and treated with 1X PBS versus IL-1β 10ng/mL with IgG or an anti-IL-6 receptor antibody Tocilizumab (1 µg/mL) for 24 h. (H-I) P-STAT3 (n = 5–6) and (H, J) DLL4 were quantified by western blot (n = 5–6). STAT3 total and ACTB were used as references. Statistical significance was determined by using a Mann-Whitney U test or Kruskal Wallis test followed by the Dunn’s multiple comparison test

