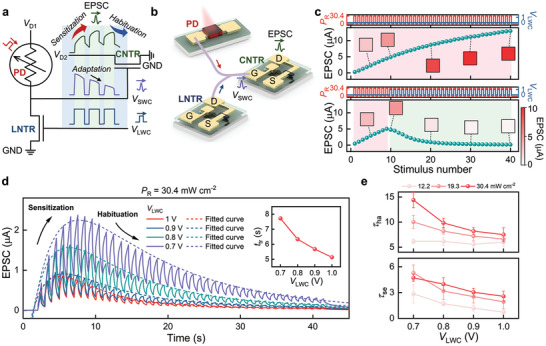
Figure 4.

Characteristics of the DAVAN device. a,b) Schematic illustration of the habituation behavior of the EPSC response of a DAVAN device. The EPSC relies on action potential, which is dependent on both P R and V LWC. c) Plot of the EPSC response peaks of a DAVAN device under repeated optical irradiations without V LWC (top) and the onset of V LWC at the tenth stimulus (bottom). d) Dynamic EPSC responses of a DAVAN device at different V LWC amplitudes under the same optical power density (solid line). The habituation curves can be well fitted by a double‐exponential model (dashed line). The inset is a plot of transition times from sensitization dominant to habituation dominant. e) τse and τha were derived from (d) and Figure S27, Supporting Information, as a function of V LWC amplitude.
