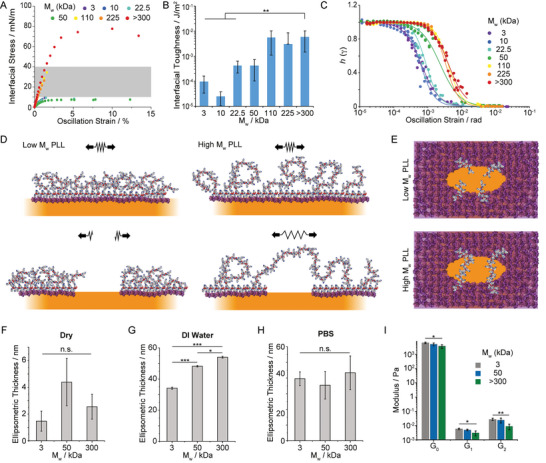
Figure 3.

The nanoscale architecture of PLL nanosheets controls interfacial toughness. A) Representative shear stress‐strain curves extracted from amplitude sweep experiments (frequency of 0.1 Hz). The grey area shaded correspond to the range of interfacial stresses expected to be exerted by mature focal adhesions. B) Summary of interfacial toughness calculated from the corresponding shear stress–strain profiles. (error bars are s.e.m.; n ≥ 3). C) Damping functions calculated from strain sweeps. The trend lines correspond to fits with the Soskey–Winter model. D,E) Proposed model of nanosheet fracture, depending on the molecular weight of PLL chains (D, side view; E, top view; only some chains localized at the fracture line are represented for improved visualization). Ellipsometric thickness of selected nanosheets determined F) dry, G) in deionized (DI) water, and H) PBS. Nanosheets were transferred to silicon substrates using a Langmuir–Blodgett liquid–liquid trough, prior to characterization. Error bars are s.e.m.; n = 3. I) Summary of magnetic‐tweezer assisted interfacial microrheology data (shear moduli G 0, G 1, and G 2 extracted using the six elements Burger's model). Detail of interfaces: Novec 7500 containing 10 µg mL−1 PFBC; aqueous solution is PBS with pH adjusted to 10.5; PLL with different M w (3, 10, 22.5, 50, 110, 225, and >300 kDa) at a final concentration of 100 µg mL−1. Error bars are s.e.m.; n ≥ 7. One‐way ANOVA; n.s., non‐significant; *p < 0.05; **p < 0.01; ***p < 0.001.
