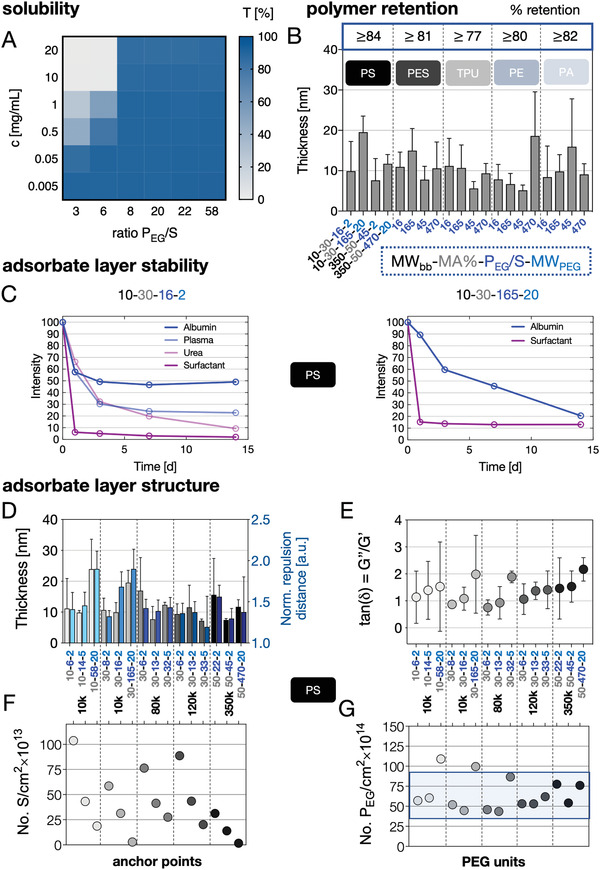
Figure 1.

Physicochemical properties of the APs and the resulting adsorbate layers on various substrates. A) Solubility: Transmission recorded at 450 nm of AP solutions (concentration range of c = 0.005–20 g L−1) dissolved in PBS plotted in regard to increasing PEG/S ratios. B) Quartz crystal microbalance with dissipation monitoring (QCM‐D)‐based adsorption measurements from APs (c = 1 g L−1) dissolved in PBS on PS, PES, TPU, PE, and PA substrates. The layer thickness was calculated from frequency and dissipation changes using a viscoelastic model. C) Stability of fluorescently labeled AP (left: 10–30–16–2) and (right: 10–30–165–20) coatings on PS substrates incubated under application relevant conditions (37 °C; plate shaker) for 14 days displayed as a percentage of retained fluorescence intensity. D–G) The impact of the molecular AP architecture on the resulting adsorbate layer structure has been analyzed in detail for PS surfaces using QCM‐D measurements based on a viscoelastic model and with atomic force microscopy (AFM)‐based force spectroscopy measurements. APs with similar backbone molecular weight (MWbb) are grouped and the corresponding thicknesses (QCM‐D) and normalized repulsion distances (AFM) are shown (D). E–G) Ratio of loss to storage moduli as a measure for hydration/viscoelasticity (E), number of anchor points (styrene units) per cm2 (F), and number of PEG units per cm2 are plotted for increasing PEG/S ratios (G).
