
Figure 5.
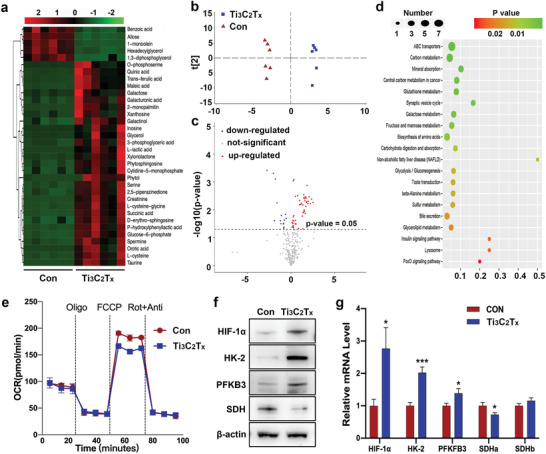
Ti3C2T x triggered metabolic reprogramming in hPDLCs. GC‐MS was utilized to measure changes in the metabolites of the cells. a) Heatmap of metabolites that were differentially regulated. Red, upregulation; green, downregulation. b) PCA plot based on intracellular metabolites. c) Volcano plot of metabolites that were differentially regulated. Red, upregulation; blue, downregulation; gray, not significant. d) Pathway enrichment analysis by KEGG. e) Basal OCR and real‐time changes in the OCR in the PDLSCs stimulated with Ti3C2T x for 7 d. Cell cultures were treated sequentially with oligomycin, FCCP, and rotenone + antimycin A. f) Protein levels of the indicated genes were determined by western blots. g) Transcription of genes at 5 d was measured by qPCR. *P < 0.05, ***P < 0.001, versus the control group.