
Figure 2.
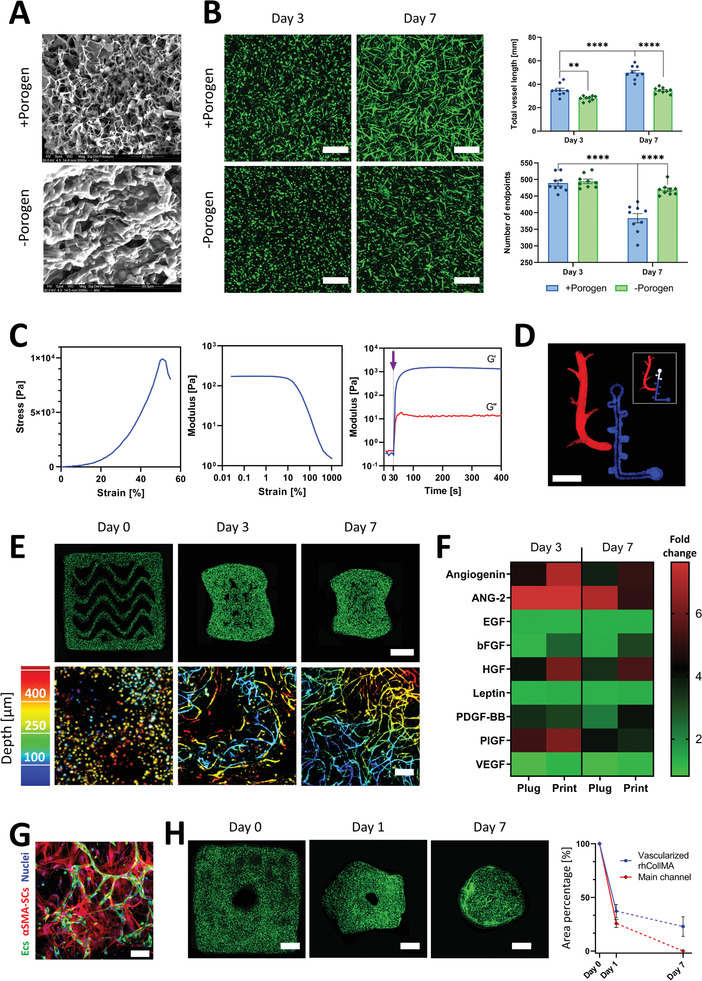
Bioink calibration and characterization for 3D bioprinting of functional self‐assembling vascular networks. A) Representative SEM images of rhCollMA with (top) and without (bottom) PEO porogen. B) Left, vessel spontaneous formation in ‐porogen and +porogen rhCollMA plugs at days 3 and 7 (scale bar: 200 µm). Right, total vessel length and number of vessel endpoints quantification for –porogen and +porogen plugs for days 3 and 7. C) Rheological and mechanical characterization for the bioink formulation: left, characteristic stress–strain curve during compression tests of a rhCollMA plug; center, linear viscoelastic range assessment using an amplitude sweep test; right, storage modulus G′ and loss modulus G″ curves for the bioink before and after cross‐linking. The purple arrow indicates the time of initialization of the photopolymerization process. (n > 3) D) Confocal image of a bioprinted Levenberg Lab logo using a multi‐material rhCollMA bioprinter with two fluorescent polystyrene microsphere colors; the insert shows the actual logo design (scale bar: 5 mm). E) Confocal images of vessel network formation in 3D bioprinted constructs at days 0, 3, and 7. The top row shows the full construct in which the ZsGreen‐ECs (green) organize and form vessels (scale bar: 1 mm). The bottom row shows higher magnification confocal images of the engineered vessel networks using a depth color‐coded projection (scale bar: 200 µm). F) Heatmap comparing secreted cytokines during the vascularization process by vessels forming within bioink plugs and 3D bioprinted structures. Values are calculated as fold change from day 1. G) Representative confocal image of formed vessels (ZsGreen‐ECs, green) and αSMA‐expressing SCs (red) at day 7, evidencing SCs recruitment and differentiation, an indication of vessel network maturation and stabilization. H) Bioprinted tissues present significant compaction during vessel formation. Left, confocal images of a bioprinted vascularized construct presenting a designed main channel and the subsequent gel shrinkage during one week of culture. Right, quantification of the total printed area and main channel area shrinkage as a percentage of their original total area. By day 7, the main channel was not discernable (scale bar: 1 mm). The dashed lines represent a non‐quantified progression. For all experiments: n > 3, **p < 0.01, ****p < 0.0001.