
Figure 3.
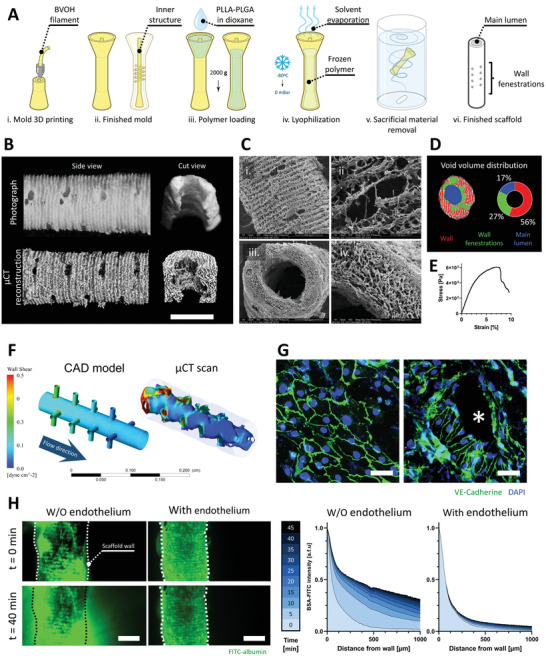
VascFold fabrication, characterization, and endothelialization for creating mesoscale vessel‐like constructs. A) Schematic explaining the VascFold fabrication process: i) A mold is printed using water‐soluble BVOH material, resulting in ii) a hollow cylindrical shape with a central rod connected to the outer wall by several perpendicular rods. iii) Using a centrifuge, the mold is filled with a 7% PLLA‐PLGA in dioxane solution, iv) frozen at −80 °C and then lyophilized, which removes the solvent from the solution, leaving a porous polymeric scaffold within the mold. v) The construct is then washed in DDW, vi) resulting in the finished scaffold with a central lumen and wall fenestrations. B) Representative side view and longitudinal cut view photographs and µCT reconstructions of a scaffold segment (scale bar: 1 mm). C) SEM images showing (i) the side fenestrations, (ii) the outer wall porosity, (iii) the main lumen, and (iv) the wall bulk porosity. D) Left, representative µCT pore segmentation of a scaffold transversal section containing wall fenestrations. Right, VascFold void volume distribution. E) Representative stress‐strain curve for the porous scaffold wall under axial stretching. F) Wall shear stress simulations of 50 µL min−1 medium flow within the CAD model and the actual inner VascFold surface using µCT imaging reconstruction (the outer wall can be seen grayed out). G) Under low flow (50 µL min−1), ECs form an endothelium‐like organization on the VascFold lumen wall), observable by the intercellular adhesion protein VE‐Cad (green; nuclei in blue). On areas with low wall shear stress, ECs show a cobblestone organization (left), while in areas next to the fenestrations (denoted by an asterisk), the ECs align in the direction of the flow (right; scale bar: 50 µm). H) Left, confocal images of FITC‐albumin diffusing freely through VascFold walls without endothelium over time but remaining entrapped in the lumen of endothelialized VascFolds (scale bar: 1 mm). Right, quantification of FITC‐albumin fluorescent intensity as a function of the distance from the scaffold wall. Darker shades of blue indicate later time steps after the FITC‐albumin perfusion started (n > 3).