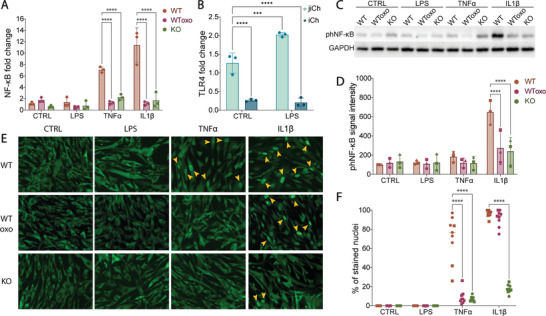
Figure 3.

NF‐κB levels and activity are reduced in TAK1‐KO cells. A) qPCR‐based gene expression levels of NF‐κB in WT, oxozeaenol‐treated WT (WToxo), and KO cells treated with inflammatory stimuli for 16 h (n = 9 from 3 donors). B) qPCR‐based gene expression levels of TLR4 in adult chondrocytes derived from joint injury reconstruction (jiCh) and infant chondrocytes (iCh) treated with LPS (n = 3). C) Western Blot and D) quantification of Ser‐536 phosphorylated NF‐κB protein in 30 min‐treatment cells compared to GAPDH levels (n = 3 from 3 donors). E) Immunofluorescence of NF‐κB to detect its translocation to the nuclei after 30 min stimulation with inflammatory signals (yellow arrows indicate the positively stained nuclei) and F) percentage of the nuclei that stained strongly (n = 9 from 3 donors). Error bars represent SD. ***p < 0.001, ****p < 0.0001.
