
Figure 5.
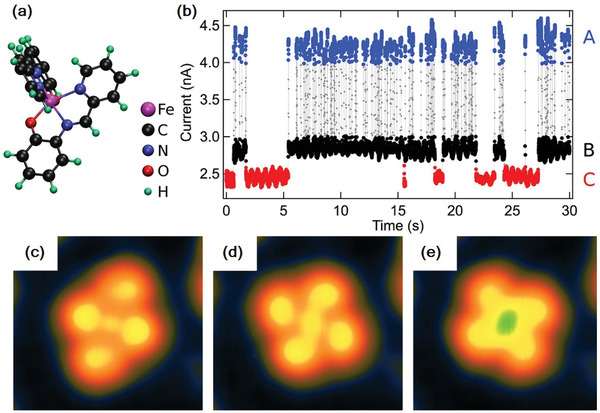
a) Structure of [Fe(pap)2]. b) Tunneling current variation with time of [Fe(pap)2] recorded at a sample voltage of 2.5 V, the three different values reflecting the three spin states: the highest (blue) has the structure (c) and is identified as the HS state; the two lower values (black and red) have the structures (d) and (e), respectively, and are identified as the two LS states. The STM is operated at ≈4 K. Reproduced with permission.[ 23 ] Copyright 2017, American Chemical Society.