Figure 3.

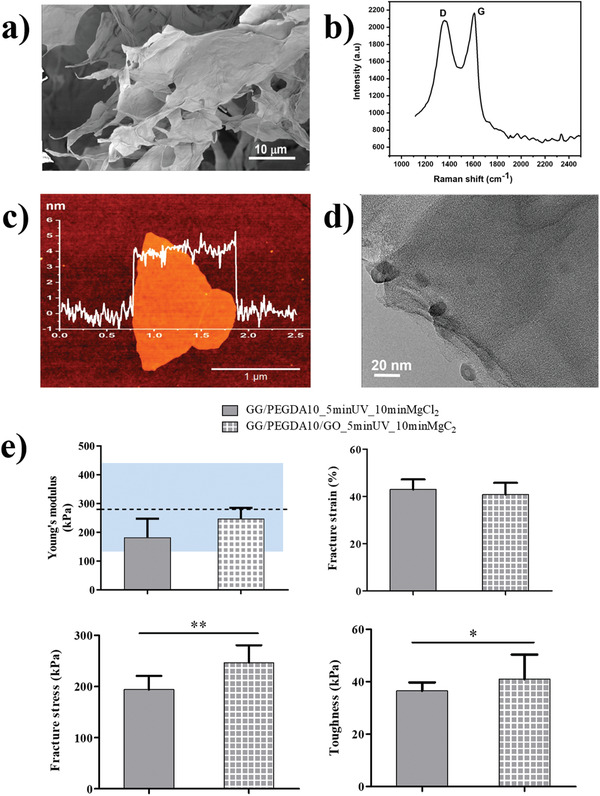
Characterization of GO and its inclusion in the hydrogel: a) SEM images of layered GO flakes; b) Raman spectrum at 532 nm; c) AFM measurements of a dispersed GO demonstrated minimal thickness of 4.0 ± 0.3 nm (n = 5); d) HRTEM image, confirming the layered structure of a dispersed GO. e) Analysis of the nanocomposite GG/PEGDA10/GO_5 minUV_10 minMgCl2: Young's modulus, fracture stress, fracture strain, and toughness. For the Young's modulus, the blue areas represent the range of stiffness featuring the superficial articular cartilage, reported in ref. [ 5b ]. Data presented as mean ± SD, n = 5, p‐values are calculated using the Student's t‐tests, * p < 0.05, ** p < 0.01. Analyzed samples: GG/PEGDA10_5 minUV_10 minMgCl2, GG/PEGDA10/GO_5 minUV_10 minMgCl2.
