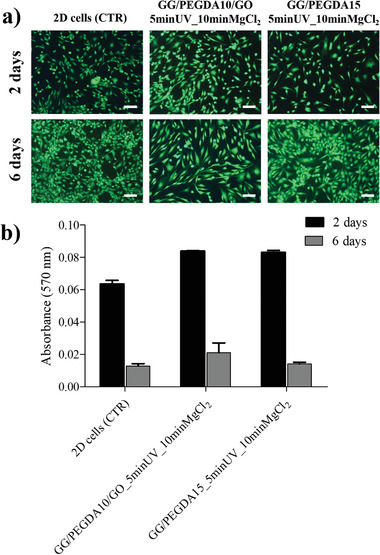
Figure 7.

a) Live/dead images of 2D chondrocytes untreated (CTR), treated with GG/PEGDA10/GO_5 minUV_10 minMgCl2 supernatant, and treated with GG/PEGDA15_5 minUV_10 minMgCl2 supernatant evaluated after 2 and 6 d. Viable cells are shown in green dead/necrotic cells are shown in red. Scale bars: 200 µm. b) MTT test of the same samples evaluated after 2 and 6 d. Data presented as mean ± SD, n = 4, p‐values are calculated using the Student's t‐tests. Analyzed samples: GG/PEGDA10/GO_5 minUV_10 minMgCl2, GG/PEGDA15_5 minUV_10 minMgCl2.
