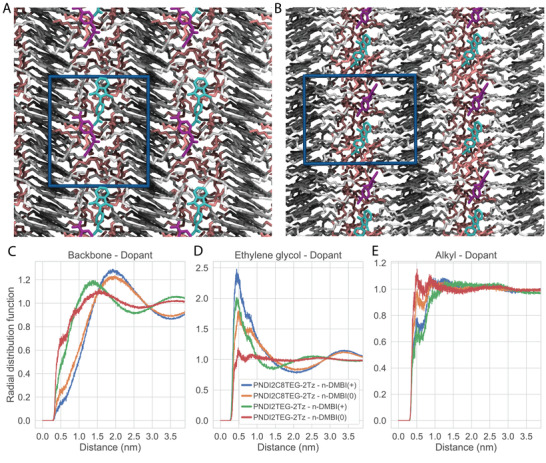
Figure 2.

Representative morphologies from the MD simulations for A) PNDI2TEG‐2Tz and B) PNDI2C8TEG‐2Tz. Dark gray = backbone, white = alkyl units, light red = ethylene glycol units, green = n‐DMBI(+), purple = n‐DMBI(0). Radial distribution functions (RDFs) between n‐DMBI (both cationic and neutral) and both C) molecule's backbone, D) ethylene glycol side chain units, and E) alkyl side chain units.
