Figure 2.

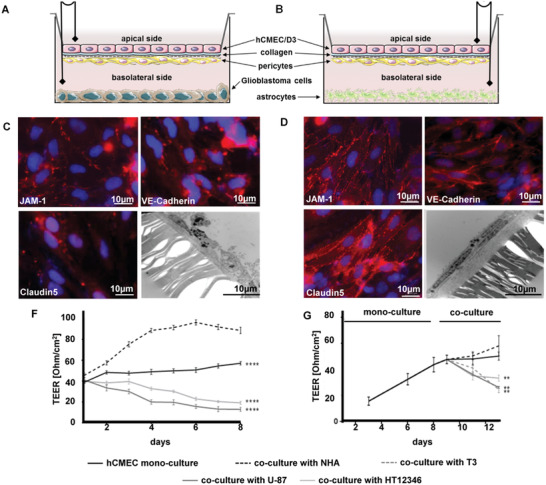
Evaluation and characterization of the in vitro BBB model under physiological and pathological conditions. A) Illustration of in vitro BBB model with human glioblastoma cell lines T3, U‐87, or HT12356. B) Illustration of an in vitro BBB model with normal human astrocytes. C) Fluorescence microscopy analysis for visualization of tight junction proteins expression on hCMEC monolayer in co‐culture with glioblastoma cells for 3 days (red: JAM‐1, VE‐Cadherin, Claudin5, blue: DAPI nucleus staining, 40‐fold magnification) and TEM image of hCMEC cells (3000‐fold magnification). D) Fluorescence microscopy analysis for visualization of tight junction proteins expression on hCMEC monolayer in co‐culture with NHA for 3 days (red: JAM‐1, VE‐Cadherin, Claudin5, blue: DAPI nucleus staining, 40‐fold magnification) and TEM image of hCMEC cells (3000‐fold magnification). E) Transepithelial electrical resistance (TEER) measurements of hCMEC/D3 mono‐culture compared to co‐culture with NHAs or glioblastoma cells. F) TEER measurements were done with mono‐culture followed by co‐culture starting on day 8. (n = 5, **p < 0.01; ****p < 0.001 compared to stable co‐culture; two‐way ANOVA, Dunnett´s multiple comparison test.)
