Figure 5.

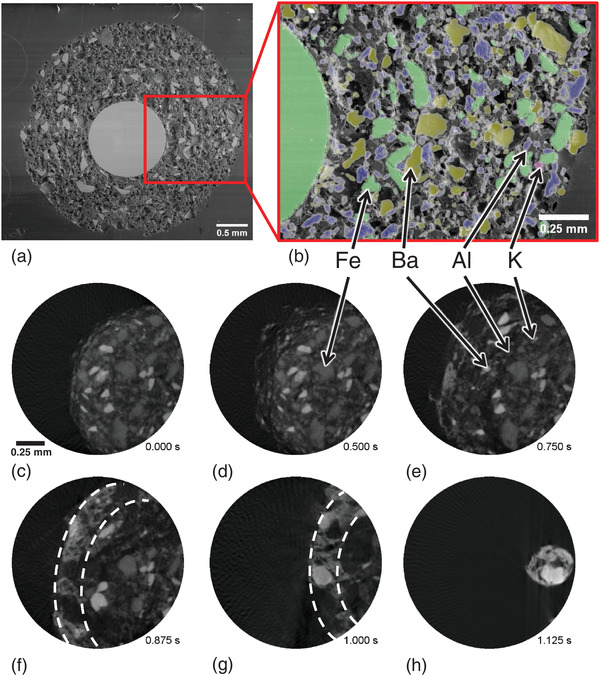
SEM images of a) the whole cross section of a sparkler and b) of a magnified segment overlapped with a colored EDX mapping (iron represented in green, aluminum in blue, barium in dark yellow and potassium in purple). c–h) X‐ray tomographic 2D slices representing different times (total acquisition period was 1.125 s) extracted from a tomoscopy sequence recorded at 400 tps after ignition (t 0 = 0 s) of the sparkler. Broken white curves in (f) and (g) show the 25‐µm thick outer layer with increased BaO/BaO2 concentration (Video S3, Supporting Information).
