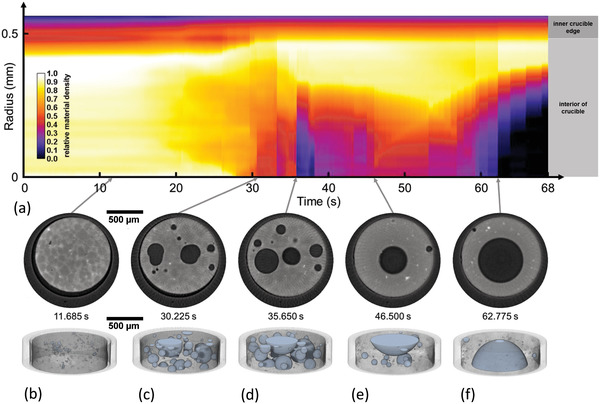
Figure 6.

Evolution of a liquid AlSi6Cu4 alloy foam recorded continuously at 650 tps over a period of 68 s. a) Relative material density calculated from measured X‐ray intensities averaged over the sample height as a function of radial position showing dense regions in light colors and bubbles in black. b–f) 2D slices extracted from center of the corresponding 3D tomograms selected at five different times. b) First bubbles grow after nucleation. Al dendrites in the precursor are still visible. c,d) Bubble evolution and coalescence in a still homogeneous gas and material distribution, the latter partially molten. e,f) Influence of radial g‐forces on the weakly stabilized now fully liquid foam leads to a mass and gas re‐allocation and eventually the formation of a single large, centered gas bubble (except for a small satellite bubble pinned to the oxide layer of the sample surface) (Video S4, Supporting Information).
